# Technical Document Extraction: Line Chart Analysis
## Chart Overview
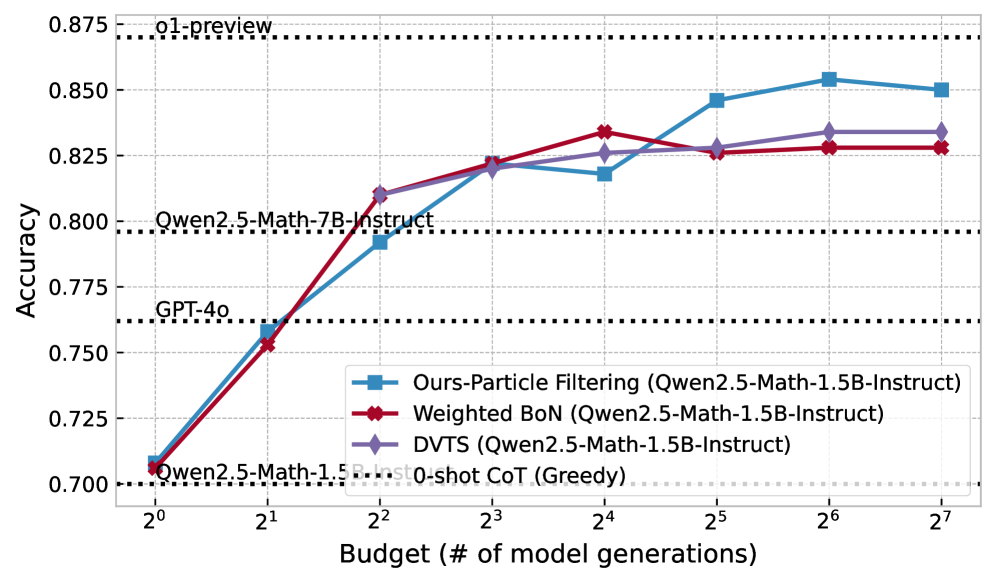
The image is a line chart comparing the accuracy of three different methods across varying computational budgets (number of model generations). The chart includes two reference lines for benchmark models.
## Axes
- **X-axis**: Budget (# of model generations)
- Logarithmic scale from 2⁰ to 2⁷
- Tick labels: 2⁰, 2¹, 2², 2³, 2⁴, 2⁵, 2⁶, 2⁷
- **Y-axis**: Accuracy
- Linear scale from 0.700 to 0.875
- Tick labels: 0.700, 0.725, 0.750, 0.775, 0.800, 0.825, 0.850, 0.875
## Legend
- **Location**: Lower-right quadrant
- **Entries**:
1. **Blue squares**: Ours-Particle Filtering (Qwen2.5-Math-1.5B-Instruct)
2. **Red diamonds**: Weighted BoN (Qwen2.5-Math-1.5B-Instruct)
3. **Purple diamonds**: DVTS (Qwen2.5-Math-1.5B-Instruct)
## Data Series
### 1. Ours-Particle Filtering (Blue)
- **Trend**: Steady upward slope with minor fluctuations
- **Key Points**:
- (2⁰, ~0.71)
- (2¹, ~0.76)
- (2², ~0.80)
- (2³, ~0.82)
- (2⁴, ~0.82)
- (2⁵, ~0.85)
- (2⁶, ~0.86)
- (2⁷, ~0.85)
### 2. Weighted BoN (Red)
- **Trend**: Initial rapid growth, peak at 2⁴, then stabilization
- **Key Points**:
- (2⁰, ~0.71)
- (2¹, ~0.76)
- (2², ~0.81)
- (2³, ~0.82)
- (2⁴, ~0.83)
- (2⁵, ~0.82)
- (2⁶, ~0.83)
- (2⁷, ~0.83)
### 3. DVTS (Purple)
- **Trend**: Gradual ascent with plateauing after 2⁵
- **Key Points**:
- (2⁰, ~0.71)
- (2¹, ~0.76)
- (2², ~0.81)
- (2³, ~0.82)
- (2⁴, ~0.83)
- (2⁵, ~0.83)
- (2⁶, ~0.83)
- (2⁷, ~0.83)
## Reference Lines
- **o1-preview**: Horizontal dotted line at y=0.875
- **GPT-4o**: Horizontal dotted line at y=0.75
## Additional Labels
- **Qwen2.5-Math-7B-Instruct**: Horizontal dotted line at y=0.80
- **GPT-4o**: Horizontal dotted line at y=0.75
## Spatial Grounding
- **Legend**: Lower-right quadrant (x > 0.5, y < 0.5 in normalized coordinates)
- **Data Point Colors**:
- Blue squares match "Ours-Particle Filtering"
- Red diamonds match "Weighted BoN"
- Purple diamonds match "DVTS"
## Trend Verification
- **Blue Line**: Consistent upward trajectory with minor fluctuations
- **Red Line**: Sharp rise to 2⁴, then slight decline and stabilization
- **Purple Line**: Steady increase until 2⁵, then plateau
## Component Isolation
1. **Header**: Chart title not explicitly visible
2. **Main Chart**: Three data series with reference lines
3. **Footer**: Legend and axis labels
## Language Analysis
- **Primary Language**: English
- **Secondary Languages**: None detected
## Data Reconstruction
No explicit data table present. Values extracted from plotted points and trend analysis.