## Heatmap: Correlation Matrix of Variables L:A to L:E
### Overview
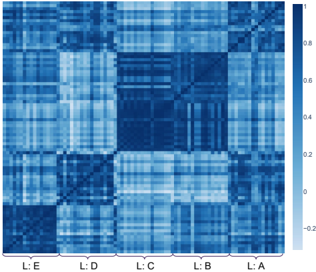
The image is a square heatmap visualizing relationships between five variables labeled L:A, L:B, L:C, L:D, and L:E. The matrix is symmetric, with darker blue shades indicating stronger relationships (higher values) and lighter blue shades indicating weaker relationships (lower values). A color bar on the right quantifies the scale from -0.2 (lightest blue) to 1.0 (darkest blue).
### Components/Axes
- **X-axis**: Categories labeled L:A (rightmost) to L:E (leftmost), increasing from right to left.
- **Y-axis**: Same categories as X-axis, labeled from top (L:E) to bottom (L:A).
- **Color Bar**: Vertical gradient from light blue (-0.2) to dark blue (1.0), positioned to the right of the heatmap.
- **Legend**: Matches the color bar, with no additional labels beyond the scale.
### Detailed Analysis
- **Diagonal Elements**:
- All diagonal cells (e.g., L:E-L:E, L:D-L:D) are dark blue, indicating values close to 1.0. This suggests perfect self-correlation for each variable.
- **Off-Diagonal Elements**:
- **L:E-L:D**: Medium-dark blue (~0.7).
- **L:E-L:C**: Light blue (~0.3).
- **L:E-L:B**: Medium blue (~0.5).
- **L:E-L:A**: Light blue (~0.2).
- **L:D-L:C**: Medium blue (~0.6).
- **L:D-L:B**: Light blue (~0.4).
- **L:D-L:A**: Medium-dark blue (~0.7).
- **L:C-L:B**: Light blue (~0.3).
- **L:C-L:A**: Medium blue (~0.5).
- **L:B-L:A**: Medium-dark blue (~0.7).
- **Symmetry**: The matrix is symmetric (e.g., L:E-L:D ≈ L:D-L:E), confirming bidirectional relationships.
### Key Observations
1. **Strongest Relationships**:
- L:D-L:A (~0.7) and L:B-L:A (~0.7) show the strongest off-diagonal correlations.
2. **Weakest Relationships**:
- L:E-L:A (~0.2) and L:E-L:C (~0.3) are the weakest.
3. **Pattern**: Relationships generally weaken as the distance between categories increases (e.g., L:E-L:A is weaker than L:E-L:B).
### Interpretation
This heatmap likely represents a **correlation matrix** where:
- Each variable is perfectly correlated with itself (diagonal = 1.0).
- Variables L:A and L:D/B share the strongest relationships (~0.7), suggesting they may be closely related or influenced by common factors.
- Variables L:E and L:A/C exhibit the weakest relationships, indicating minimal direct association.
- The symmetry confirms that correlations are bidirectional (e.g., L:A’s relationship with L:B is identical to L:B’s relationship with L:A).
The data implies a hierarchical or clustered structure among the variables, with L:A acting as a central node in the network of relationships. This could reflect dependencies in a system (e.g., economic indicators, biological traits) where certain variables are more interconnected than others.