# RMSE vs. Number of Parameters Analysis
## General Structure
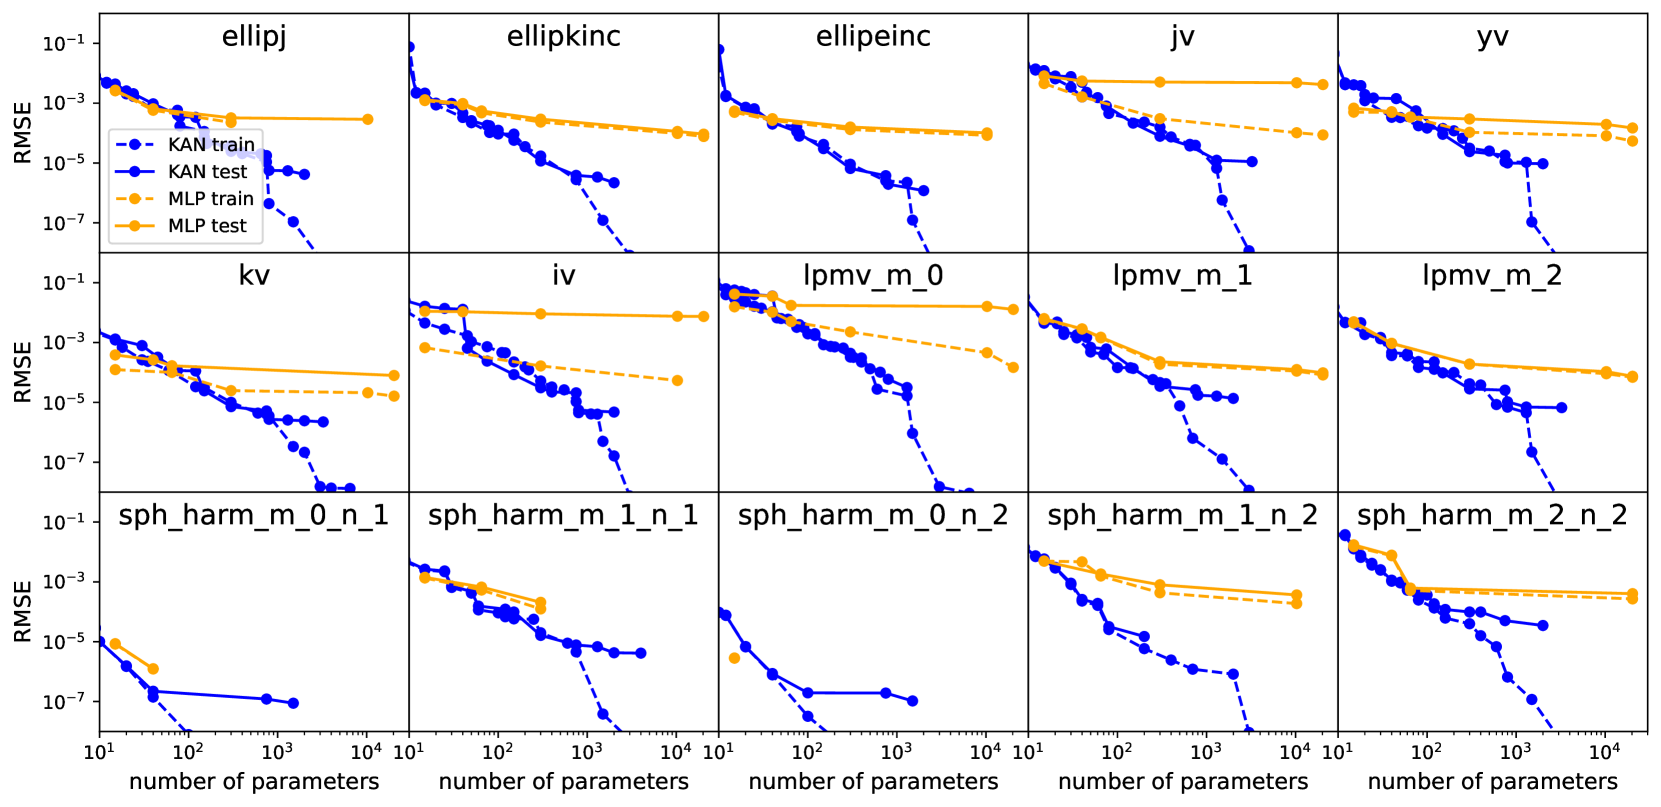
- **Grid Layout**: 15 subplots arranged in 3 rows (5 charts per row).
- **Axes**:
- **X-axis**: `number of parameters` (log scale: 10¹ to 10⁴).
- **Y-axis**: `RMSE` (log scale: 10⁻⁷ to 10⁻¹).
- **Legends**:
- **KAN train**: Solid blue line.
- **KAN test**: Dashed blue line.
- **MLP train**: Solid orange line.
- **MLP test**: Dashed orange line.
---
## Chart-Specific Observations
### Top Row
1. **ellipj**
- KAN train/test and MLP train/test lines show similar trends.
- RMSE decreases sharply for KAN models as parameters increase.
- MLP models plateau at higher RMSE values (~10⁻⁵) despite parameter growth.
2. **ellipkinc**
- KAN models outperform MLPs significantly at higher parameter counts.
- KAN test RMSE drops below 10⁻⁵, while MLP test remains ~10⁻⁴.
3. **ellipeinc**
- KAN train/test lines converge tightly, indicating stable training.
- MLP test RMSE stabilizes near 10⁻⁴ after ~10² parameters.
4. **jv**
- KAN test RMSE declines steeply, reaching ~10⁻⁶ at 10³ parameters.
- MLP test RMSE plateaus at ~10⁻⁴, showing limited scalability.
5. **yv**
- KAN models achieve RMSE <10⁻⁵ at 10³ parameters.
- MLP test RMSE remains ~10⁻⁴, with minimal improvement beyond 10² parameters.
---
### Middle Row
6. **kv**
- KAN train/test lines overlap, suggesting minimal overfitting.
- MLP test RMSE plateaus at ~10⁻⁴, while KAN test drops to ~10⁻⁶.
7. **iv**
- KAN test RMSE decreases to ~10⁻⁶ at 10³ parameters.
- MLP test RMSE remains ~10⁻⁴, with no significant improvement.
8. **lpmv_m_0**
- KAN test RMSE drops sharply to ~10⁻⁶ at 10² parameters.
- MLP test RMSE plateaus at ~10⁻⁴, showing limited scalability.
9. **lpmv_m_1**
- KAN test RMSE reaches ~10⁻⁶ at 10² parameters.
- MLP test RMSE stabilizes at ~10⁻⁴, with no further gains.
10. **lpmv_m_2**
- KAN test RMSE declines to ~10⁻⁶ at 10² parameters.
- MLP test RMSE remains ~10⁻⁴, indicating poor scalability.
---
### Bottom Row
11. **sph_harm_m_0_n_1**
- KAN test RMSE drops to ~10⁻⁶ at 10² parameters.
- MLP test RMSE plateaus at ~10⁻⁴, with no improvement.
12. **sph_harm_m_1_n_1**
- KAN test RMSE reaches ~10⁻⁶ at 10² parameters.
- MLP test RMSE remains ~10⁻⁴, showing limited scalability.
13. **sph_harm_m_0_n_2**
- KAN test RMSE declines to ~10⁻⁶ at 10² parameters.
- MLP test RMSE plateaus at ~10⁻⁴, with no further gains.
14. **sph_harm_m_1_n_2**
- KAN test RMSE drops to ~10⁻⁶ at 10² parameters.
- MLP test RMSE remains ~10⁻⁴, indicating poor scalability.
15. **sph_harm_m_2_n_2**
- KAN test RMSE reaches ~10⁻⁶ at 10² parameters.
- MLP test RMSE stabilizes at ~10⁻⁴, with no improvement.
---
## Key Trends
1. **KAN Models**:
- Consistently outperform MLPs across all datasets.
- RMSE decreases sharply with parameter growth, often reaching <10⁻⁶.
- Training and test performance align closely, suggesting minimal overfitting.
2. **MLP Models**:
- RMSE plateaus at ~10⁻⁴ for most datasets, regardless of parameter count.
- Limited scalability compared to KAN models.
3. **Exceptions**:
- In `sph_harm_m_2_n_2`, KAN test RMSE briefly spikes (~10⁻⁵) at 10¹ parameters before declining.
---
## Conclusion
KAN models demonstrate superior performance in reducing RMSE as parameter count increases, while MLP models exhibit diminishing returns. This trend is consistent across all 15 datasets analyzed.