\n
## Diagram: Collaborative Process for Goal Implementation
### Overview
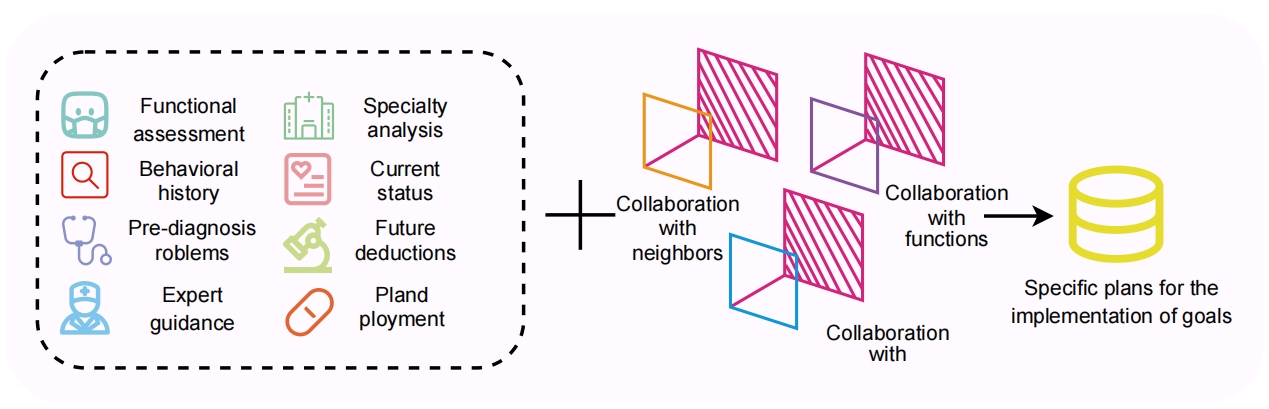
The image depicts a diagram illustrating a collaborative process, likely within a healthcare or therapeutic context, for achieving specific goals. The process involves initial assessments, analysis, collaboration, and ultimately, the implementation of plans. The diagram is divided into two main sections separated by a dashed vertical line: a section detailing initial assessments and a section illustrating the collaborative process itself.
### Components/Axes
The diagram consists of the following components:
* **Left Section (Assessments):** A dashed, rounded rectangle containing icons representing different assessment areas.
* Functional assessment (icon: person with head gears)
* Behavioral history (icon: magnifying glass)
* Pre-diagnosis problems (icon: brain with connecting lines)
* Expert guidance (icon: person with tie)
* **Right Section (Collaboration):** A series of interconnected shapes representing collaborative stages.
* Collaboration with neighbors (yellow square)
* Collaboration with functions (pink squares with red diagonal lines)
* Collaboration with (cyan square)
* **Output:** A yellow, layered cylinder shape labeled "Specific plans for the implementation of goals".
* **Arrows:** Arrows indicating the flow of the process.
### Detailed Analysis or Content Details
The left section lists four assessment areas. The right section shows a flow starting with "Collaboration with neighbors" (yellow square), then branching to "Collaboration with functions" (pink squares with red diagonal lines), and finally converging into "Collaboration with" (cyan square). An arrow then points from the cyan square to the "Specific plans for the implementation of goals" (yellow cylinder).
The diagram does not contain numerical data or precise scales. It is a conceptual representation of a process.
### Key Observations
The diagram emphasizes the importance of collaboration between different entities ("neighbors," "functions") in developing specific plans. The initial assessment phase appears to feed into the collaborative process. The use of different colors and shapes suggests distinct roles or areas of focus within the collaboration. The final output is a concrete set of plans for implementation.
### Interpretation
This diagram likely represents a multidisciplinary approach to problem-solving or goal setting. The initial assessments (functional assessment, behavioral history, etc.) provide a foundation of information. This information is then used in collaborative efforts with various stakeholders ("neighbors" could represent family, community resources, or other professionals; "functions" could represent different departments or specialties). The final outcome is a tailored plan for achieving specific goals.
The diagram suggests a holistic approach, recognizing that effective solutions require input from multiple perspectives. The layered cylinder shape representing the final plans implies a structured and well-defined outcome. The diagram does not specify the nature of the "problems" or "goals," but it highlights the process of arriving at a solution through collaboration and informed assessment. The use of icons suggests a simplified, easily understandable representation of a complex process.