## Diagram: Flow Diagram with Labeled Nodes and Arrows
### Overview
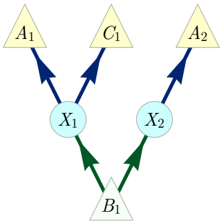
This image depicts a directed acyclic graph (DAG) illustrating relationships and flows between different components. The diagram consists of triangular and circular nodes, connected by arrows indicating the direction of influence or data flow.
### Components/Axes
There are no explicit axes or scales in this diagram as it represents a conceptual flow rather than quantitative data. The components are:
* **Triangular Nodes:**
* `A₁` (Yellow triangle, top-left)
* `C₁` (Yellow triangle, top-center)
* `A₂` (Yellow triangle, top-right)
* `B₁` (Light green triangle, bottom-center)
* **Circular Nodes:**
* `X₁` (Light blue circle, center-left)
* `X₂` (Light blue circle, center-right)
* **Arrows:**
* Dark blue arrows: Indicate flow from `X₁` to `A₁` and `C₁`, and from `X₂` to `A₂`.
* Dark green arrows: Indicate flow from `B₁` to `X₁` and `X₂`.
### Detailed Analysis or Content Details
The diagram shows the following connections and flows:
1. **From `B₁`:**
* A dark green arrow originates from `B₁` and points towards `X₁`.
* A dark green arrow originates from `B₁` and points towards `X₂`.
2. **From `X₁`:**
* A dark blue arrow originates from `X₁` and points towards `A₁`.
* A dark blue arrow originates from `X₁` and points towards `C₁`.
3. **From `X₂`:**
* A dark blue arrow originates from `X₂` and points towards `A₂`.
### Key Observations
* The node `B₁` appears to be a source, with outgoing connections to both `X₁` and `X₂`.
* The nodes `X₁` and `X₂` act as intermediate points, receiving input from `B₁` and distributing it to other nodes.
* The nodes `A₁`, `C₁`, and `A₂` appear to be terminal nodes, receiving input but not showing any outgoing connections within this diagram.
* There is a clear branching structure originating from `B₁` and converging towards `A₁` and `C₁` via `X₁`, and a separate branch to `A₂` via `X₂`.
### Interpretation
This diagram likely represents a process, system, or model where a single input or entity (`B₁`) is processed or split into two intermediate states or components (`X₁` and `X₂`). These intermediate components then further process or distribute their inputs to distinct outputs or final states (`A₁`, `C₁` from `X₁`, and `A₂` from `X₂`).
The structure suggests a hierarchical or tree-like relationship. `B₁` could represent an initial condition, a raw material, or a primary signal. `X₁` and `X₂` might represent processing stages, decision points, or sub-systems. `A₁`, `C₁`, and `A₂` could represent final outcomes, results, or destinations. The distinct grouping of `A₁` and `C₁` receiving input from the same intermediate node `X₁` suggests a potential shared characteristic or a common processing path for these two outputs, differentiating them from `A₂` which is processed independently via `X₂`. This could be a simplified representation of a branching process, a decision tree, or a data flow architecture.