## Diagram: Hierarchical Node-Link Structure
### Overview
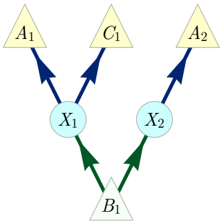
The image displays a directed graph or hierarchical diagram composed of geometric shapes (triangles and circles) connected by colored arrows. The structure suggests a flow or relationship system originating from a single base element, branching into intermediate nodes, and finally reaching terminal nodes. The diagram uses color-coding for both shapes and connecting lines to denote different categories or types of relationships.
### Components/Axes
**Shapes & Labels:**
* **Top Row (Terminal Nodes):** Three light-yellow triangles.
* Left: Labeled `A₁`
* Center: Labeled `C₁`
* Right: Labeled `A₂`
* **Middle Row (Intermediate Nodes):** Two light-blue circles.
* Left: Labeled `X₁`
* Right: Labeled `X₂`
* **Bottom Row (Base Node):** One gray triangle.
* Center: Labeled `B₁`
**Connections (Arrows):**
* **Green Arrows:** Two arrows originating from the base node `B₁`.
* One points upward and left to circle `X₁`.
* One points upward and right to circle `X₂`.
* **Blue Arrows:** Three arrows originating from the intermediate nodes.
* From `X₁`: One arrow points upward and left to triangle `A₁`.
* From `X₁`: One arrow points upward and right to triangle `C₁`.
* From `X₂`: One arrow points upward to triangle `A₂`.
**Spatial Layout:**
* The diagram is vertically organized into three distinct tiers.
* `B₁` is positioned at the bottom center.
* `X₁` and `X₂` are positioned in the middle tier, horizontally offset from the center (`X₁` left, `X₂` right).
* `A₁`, `C₁`, and `A₂` are positioned across the top tier, with `C₁` roughly centered above the gap between `X₁` and `X₂`.
### Detailed Analysis
**Flow and Relationships:**
1. **Primary Branching:** The base element `B₁` has a dual relationship, connecting to both intermediate nodes `X₁` and `X₂` via green arrows. This indicates `B₁` is a common source or parent for both `X` nodes.
2. **Secondary Branching:**
* Node `X₁` has a dual output, connecting to two distinct terminal nodes: `A₁` and `C₁` via blue arrows.
* Node `X₂` has a single output, connecting to terminal node `A₂` via a blue arrow.
3. **Color-Coding Logic:**
* **Shape Color:** Differentiates node tiers or types: Yellow (Terminal), Blue (Intermediate), Gray (Base).
* **Arrow Color:** Differentiates the stage or nature of the relationship: Green (Base-to-Intermediate), Blue (Intermediate-to-Terminal).
**Structural Summary:**
The graph forms two main branches originating from `B₁`:
* **Left Branch:** `B₁` → `X₁` → (`A₁`, `C₁`)
* **Right Branch:** `B₁` → `X₂` → `A₂`
### Key Observations
* **Asymmetry:** The left branch (`X₁`) is more complex, feeding two terminal nodes, while the right branch (`X₂`) feeds only one.
* **Labeling Pattern:** The terminal nodes use the letters `A` and `C` with numeric subscripts (`A₁`, `A₂`, `C₁`). The intermediate nodes use the letter `X` with subscripts (`X₁`, `X₂`). The base node uses `B₁`.
* **Visual Hierarchy:** The use of triangles for terminal/base nodes and circles for intermediate nodes creates a clear visual distinction between the start/end points and the processing or junction points in the system.
### Interpretation
This diagram represents a **one-to-many hierarchical or process flow system**. It models how a single source (`B₁`) initiates a process that splits into two parallel or alternative pathways (`X₁` and `X₂`). These pathways then lead to different outcomes or endpoints.
* **`B₁`** likely represents a **root cause, primary input, or foundational category**.
* **`X₁` and `X₂`** represent **intermediate processes, sub-categories, or decision points** that transform or route the initial input.
* **`A₁`, `C₁`, and `A₂`** represent **final outcomes, results, or leaf categories**.
The asymmetry suggests that the pathway through `X₁` is more generative or leads to a more diverse set of results (`A₁` and `C₁`) compared to the pathway through `X₂`. The consistent labeling (`A` vs. `C`) might imply that `A₁` and `A₂` are of a similar type (e.g., "Type A" outcomes), while `C₁` is a distinct type. This structure is common in **organizational charts, decision trees, taxonomic classifications, or causal pathway models**.