# Technical Document Extraction: Dual-Graph Analysis
## Left Graph: Loss vs Parameters
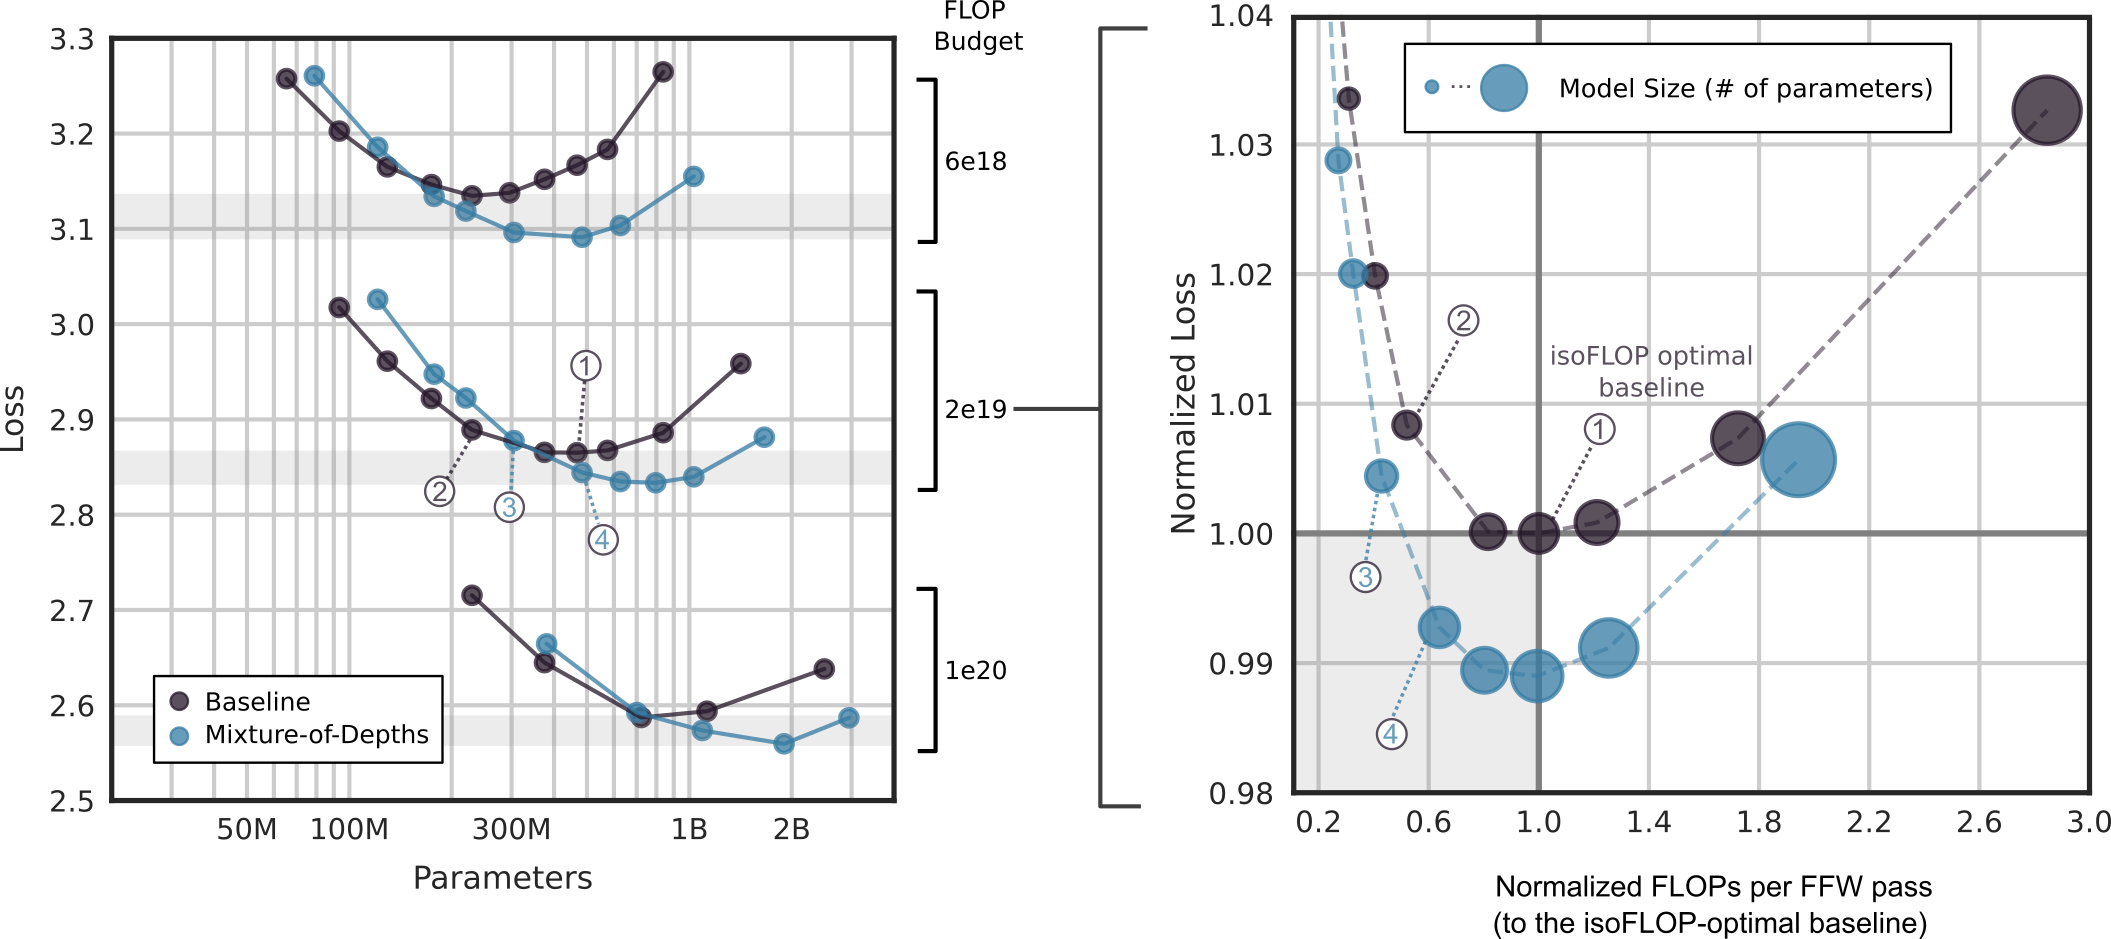
### Axes
- **X-axis**: "Parameters" (logarithmic scale)
- Markers: 50M, 100M, 300M, 1B, 2B
- **Y-axis**: "Loss" (linear scale)
- Range: 2.5 to 3.3
- Shaded bands:
- 2.6–2.7 (bottom)
- 2.8–2.9 (middle)
- 3.1–3.2 (top)
### Legend
- **Baseline**: Black dots
- **Mixture-of-Depths**: Blue dots
### Data Trends
1. **Baseline (Black)**:
- Loss decreases from ~3.25 (50M params) to ~2.65 (300M params).
- Sharp increase to ~3.25 at 1B params, then gradual decline to ~2.65 at 2B params.
2. **Mixture-of-Depths (Blue)**:
- Loss decreases from ~3.25 (50M params) to ~2.85 (300M params).
- Slight increase to ~2.9 at 1B params, then decline to ~2.6 at 2B params.
3. **Annotations**:
- **1**: Peak at ~3.25 loss (Baseline, 1B params).
- **2**: Local minimum at ~2.85 loss (Mixture-of-Depths, 300M params).
- **3**: Baseline loss at ~2.7 (300M params).
- **4**: Mixture-of-Depths loss at ~2.6 (2B params).
## Right Graph: Normalized Loss vs Normalized FLOPs
### Axes
- **X-axis**: "Normalized FLOPs per FFW pass (to isoFLOP-optimal baseline)"
- Range: 0.2 to 3.0
- Vertical dashed line at 1.0 (isoFLOP-optimal baseline).
- **Y-axis**: "Normalized Loss"
- Range: 0.98 to 1.04
### Legend
- **Model Size (# of parameters)**: Blue circles (size proportional to parameter count).
### Data Trends
1. **Model Sizes**:
- Larger models (e.g., 2B params) cluster near the isoFLOP-optimal baseline (1.0 FLOPs).
- Smaller models (e.g., 50M params) show higher normalized loss (~1.03) and lower FLOPs (~0.2).
2. **Key Points**:
- **1**: Baseline model at 1.0 FLOPs (isoFLOP-optimal baseline).
- **2**: Model with ~1.03 normalized loss (smaller size, ~0.6 FLOPs).
- **3**: Model with ~0.99 normalized loss (larger size, ~1.4 FLOPs).
- **4**: Model with ~0.98 normalized loss (largest size, ~2.0 FLOPs).
### Cross-Referenced Observations
- **Efficiency Trade-off**: Larger models achieve lower normalized loss but require more FLOPs.
- **Baseline vs Mixture-of-Depths**:
- In the left graph, Mixture-of-Depths consistently outperforms Baseline in loss reduction across parameter scales.
- In the right graph, Mixture-of-Depths models align closer to the isoFLOP-optimal baseline, indicating better FLOP efficiency.
### Critical Notes
- Shaded bands in the left graph likely represent confidence intervals or target loss thresholds.
- The isoFLOP-optimal baseline (dashed line) serves as a reference for FLOP efficiency in the right graph.