## Line Chart: Benchmark: Average
### Overview
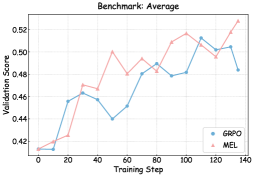
The chart compares the validation scores of two methods, **GRPO** (blue line) and **MEL** (pink line), across 140 training steps. Both lines exhibit fluctuating trends, with MEL generally outperforming GRPO in later stages.
### Components/Axes
- **X-axis (Training Step)**: Ranges from 0 to 140 in increments of 20.
- **Y-axis (Validation Score)**: Ranges from 0.42 to 0.52 in increments of 0.02.
- **Legend**: Located in the bottom-right corner.
- **GRPO**: Blue line with circular markers.
- **MEL**: Pink line with triangular markers.
### Detailed Analysis
#### GRPO (Blue Line)
- **Trend**: Starts at 0.42 (step 0), rises sharply to 0.46 (step 20), dips to 0.44 (step 50), then fluctuates between 0.48–0.51, ending at 0.485 (step 140).
- **Key Points**:
- Step 0: 0.42
- Step 20: 0.46
- Step 30: 0.465
- Step 50: 0.44
- Step 70: 0.48
- Step 80: 0.49
- Step 100: 0.48
- Step 110: 0.51
- Step 120: 0.50
- Step 140: 0.485
#### MEL (Pink Line)
- **Trend**: Begins at 0.42 (step 0), rises to 0.47 (step 30), dips to 0.465 (step 40), then climbs to 0.525 (step 140), with peaks at 0.515 (step 90) and 0.52 (step 130).
- **Key Points**:
- Step 0: 0.42
- Step 20: 0.425
- Step 30: 0.47
- Step 40: 0.465
- Step 50: 0.48
- Step 60: 0.495
- Step 70: 0.485
- Step 80: 0.51
- Step 90: 0.515
- Step 100: 0.515
- Step 110: 0.505
- Step 120: 0.51
- Step 140: 0.525
### Key Observations
1. **Initial Divergence**: MEL surpasses GRPO around step 30, maintaining a higher validation score thereafter.
2. **Fluctuations**: Both lines show volatility, but MEL’s peaks are consistently higher after step 80.
3. **Final Performance**: MEL ends at 0.525 (step 140), while GRPO ends at 0.485, a 0.04 difference.
4. **Crossings**: The lines intersect multiple times (e.g., steps 30, 50, 80), indicating shifting performance dynamics.
### Interpretation
- **Performance Comparison**: MEL demonstrates superior validation scores in later training stages, suggesting better generalization or optimization efficiency.
- **Volatility**: GRPO’s fluctuations may indicate instability or sensitivity to training noise, whereas MEL’s steadier ascent implies robustness.
- **Practical Implications**: If validation score is the primary metric, MEL appears more effective for this benchmark. However, GRPO’s earlier peaks (e.g., step 110) suggest potential for rapid improvement under specific conditions.
- **Uncertainty**: Approximate values (e.g., 0.485 vs. 0.525) reflect visual estimation from the chart; exact numerical data is not provided.
### Spatial Grounding
- **Legend**: Bottom-right corner, clearly associating colors with labels.
- **Line Placement**: GRPO (blue) and MEL (pink) occupy distinct paths, with MEL consistently trending upward after step 30.