## Chart: Benchmark Average
### Overview
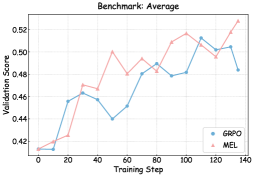
This image is a line chart comparing the validation scores of two models, GRPO and MEL, over training steps. The chart shows how the validation scores change as the models are trained.
### Components/Axes
* **Title:** Benchmark: Average
* **X-axis:** Training Step (values range from 0 to 140, with markers at 0, 20, 40, 60, 80, 100, 120, and 140)
* **Y-axis:** Validation Score (values range from 0.42 to 0.52, with markers at 0.42, 0.44, 0.46, 0.48, 0.50, and 0.52)
* **Legend:** Located in the bottom-right corner.
* GRPO (blue line with circle markers)
* MEL (pink line with cross markers)
### Detailed Analysis
* **GRPO (blue line):**
* Trend: Initially increases sharply, then fluctuates with a general upward trend.
* Data Points:
* Training Step 0: Validation Score ~0.41
* Training Step 20: Validation Score ~0.46
* Training Step 40: Validation Score ~0.46
* Training Step 60: Validation Score ~0.44
* Training Step 80: Validation Score ~0.48
* Training Step 100: Validation Score ~0.48
* Training Step 120: Validation Score ~0.50
* Training Step 140: Validation Score ~0.48
* **MEL (pink line):**
* Trend: Initially increases sharply, fluctuates, and generally trends upward.
* Data Points:
* Training Step 0: Validation Score ~0.41
* Training Step 20: Validation Score ~0.42
* Training Step 40: Validation Score ~0.47
* Training Step 60: Validation Score ~0.50
* Training Step 80: Validation Score ~0.48
* Training Step 100: Validation Score ~0.52
* Training Step 120: Validation Score ~0.50
* Training Step 140: Validation Score ~0.52
### Key Observations
* Both models start with similar validation scores.
* MEL generally has a higher validation score than GRPO, especially after ~60 training steps.
* Both models show fluctuations in their validation scores during training.
### Interpretation
The chart compares the performance of two models, GRPO and MEL, based on their validation scores during training. The data suggests that MEL generally performs better than GRPO, achieving higher validation scores as training progresses. The fluctuations in validation scores indicate that both models experience some instability during training, but the overall trend is upward, suggesting that both models are learning. The higher validation scores of MEL suggest it may be a more effective model for the given task.