\n
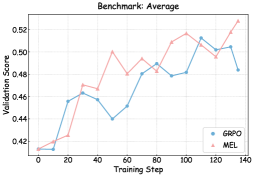
## Line Chart: Benchmark Average Validation Score vs. Training Step
### Overview
This image presents a line chart illustrating the validation score of two models, GRP0 and MEL, as a function of the training step. The chart aims to compare the performance of these models during the training process.
### Components/Axes
* **Title:** "Benchmark: Average" - positioned at the top-center of the chart.
* **X-axis:** "Training Step" - ranging from approximately 0 to 140, with grid lines at intervals of 20.
* **Y-axis:** "Validation Score" - ranging from approximately 0.42 to 0.53, with grid lines at intervals of 0.02.
* **Legend:** Located in the top-right corner of the chart.
* GRP0 - represented by a blue line with circular markers.
* MEL - represented by a pink line with triangular markers.
### Detailed Analysis
**GRP0 (Blue Line):**
The GRP0 line generally slopes upward, indicating an increasing validation score with increasing training steps.
* At Training Step 0, the Validation Score is approximately 0.43.
* At Training Step 20, the Validation Score is approximately 0.46.
* At Training Step 40, the Validation Score is approximately 0.44.
* At Training Step 60, the Validation Score is approximately 0.47.
* At Training Step 80, the Validation Score is approximately 0.48.
* At Training Step 100, the Validation Score is approximately 0.47.
* At Training Step 120, the Validation Score is approximately 0.50.
* At Training Step 140, the Validation Score is approximately 0.48.
**MEL (Pink Line):**
The MEL line exhibits more fluctuation than the GRP0 line, but also generally trends upward.
* At Training Step 0, the Validation Score is approximately 0.43.
* At Training Step 20, the Validation Score is approximately 0.45.
* At Training Step 40, the Validation Score is approximately 0.47.
* At Training Step 60, the Validation Score is approximately 0.49.
* At Training Step 80, the Validation Score is approximately 0.50.
* At Training Step 100, the Validation Score is approximately 0.51.
* At Training Step 120, the Validation Score is approximately 0.50.
* At Training Step 140, the Validation Score is approximately 0.53.
### Key Observations
* Both models start with similar validation scores around 0.43.
* The MEL model consistently achieves higher validation scores than the GRP0 model throughout the training process, particularly after Training Step 60.
* The GRP0 model shows a dip in validation score around Training Step 40, while the MEL model experiences a peak around the same step.
* The MEL model demonstrates a more pronounced increase in validation score towards the end of the training process (between Training Steps 100 and 140).
### Interpretation
The chart suggests that the MEL model outperforms the GRP0 model in terms of validation score across the observed training steps. The fluctuations in the MEL line might indicate a more sensitive or complex learning process. The consistent upward trend for both models suggests that both are learning and improving with more training. The dip in GRP0's performance around step 40 could indicate a temporary setback or a local minimum in the optimization landscape. The final validation scores suggest that the MEL model has converged to a better solution than the GRP0 model, given the training data and process. The chart provides a visual comparison of the learning curves for the two models, allowing for an assessment of their relative performance and stability during training.