\n
## Flowchart: Wind Power Simulation Process
### Overview
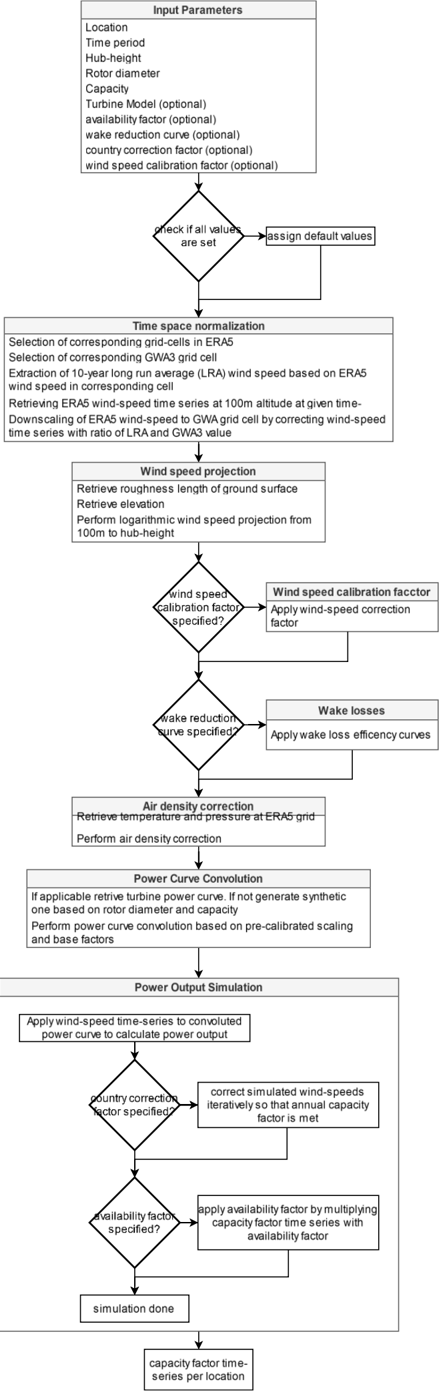
This image depicts a flowchart outlining the process of wind power simulation, from input parameters to final capacity factor time-series output. The flowchart is structured sequentially, with decision points represented by diamond shapes and process steps by rectangles. Arrows indicate the flow of the process.
### Components/Axes
The flowchart consists of the following main sections:
1. **Input Parameters:** A list of parameters used as input for the simulation.
2. **Time space normalization:** Processing of time series data.
3. **Wind speed projection:** Calculation of wind speed at hub height.
4. **Air density correction:** Adjustment for air density.
5. **Power Curve Convolution:** Generation of power output based on wind speed.
6. **Power Output Simulation:** Calculation of capacity factor.
7. **Final Output:** Capacity factor time-series.
Decision points involve checks for specified factors (wind speed calibration, wake reduction, country correction, availability).
### Detailed Analysis or Content Details
**1. Input Parameters (Top)**
* Location
* Time period
* Hub-height
* Rotor diameter
* Capacity
* Turbine Model (optional)
* Availability factor (optional)
* Wake reduction curve (optional)
* Country correction factor (optional)
* Wind speed calibration factor (optional)
**2. Check for Default Values:**
* If all values are set: Assign default values.
**3. Time space normalization:**
* Selection of corresponding grid-cells in ERA5
* Selection of corresponding GWA3 grid cell
* Extraction of 10-year long run average (LRA) wind speed based on wind speed in corresponding cell
* Rescaling ERA5 wind-speed time series at 100m altitude at given time
* Downscaling of wind-speed to GWA grid by correcting wind-speed time series with ratio of roughness and GWA height.
**4. Wind speed projection:**
* Retrieve roughness length of ground surface
* Retrieve elevation
* Perform logarithmic wind speed projection from 100m to hub-height
**5. Wind speed calibration factor:**
* If wind speed calibration factor specified?: Apply wind-speed correction factor
**6. Wake losses:**
* If wake reduction curve specified?: Apply wake loss efficiency curves
**7. Air density correction:**
* Retrieve temperature and pressure at ERA5 grid
* Perform air density correction
**8. Power Curve Convolution:**
* If applicable retrieve turbine power curve. If not generate synthetic one based on rotor diameter and capacity
* Perform power curve convolution based on pre-calibrated scaling and base factors
**9. Power Output Simulation:**
* Apply wind-speed time-series to convoluted power curve to calculate power output
**10. Country corrections:**
* If country correction factor specified?: Correct wind-speeds iteratively so total annual capacity factor is met
**11. Availability factor:**
* If availability factor specified?: Apply availability factor by multiplying capacity factor time series with availability factor
**12. Final Output:**
* Simulation done
* Capacity factor time-series for location
### Key Observations
The flowchart highlights a modular approach to wind power simulation. The process is iterative, with decision points allowing for customization based on available data and desired accuracy. The optional parameters suggest that the simulation can be adapted to various scenarios and levels of detail. The iterative correction of wind speeds based on country factors indicates an attempt to account for regional variations and improve the accuracy of the simulation.
### Interpretation
This flowchart represents a comprehensive methodology for simulating wind power generation. It demonstrates a clear understanding of the key factors influencing wind turbine performance, including wind speed, air density, wake effects, and turbine characteristics. The inclusion of optional parameters and iterative correction steps suggests a flexible and adaptable simulation framework. The ultimate goal is to generate a reliable capacity factor time-series, which is crucial for assessing the economic viability and grid integration of wind power projects. The process is designed to move from raw input data (location, time period, turbine specs) through a series of increasingly refined calculations to a final output that represents the expected power generation profile. The decision diamonds indicate that the simulation can be tailored to specific conditions, and the iterative correction steps suggest a commitment to accuracy. The flowchart is a valuable tool for engineers and researchers involved in wind energy development and analysis.