## Grouped Bar Chart: Gemini 1.5 Pro Benchmark Comparison
### Overview
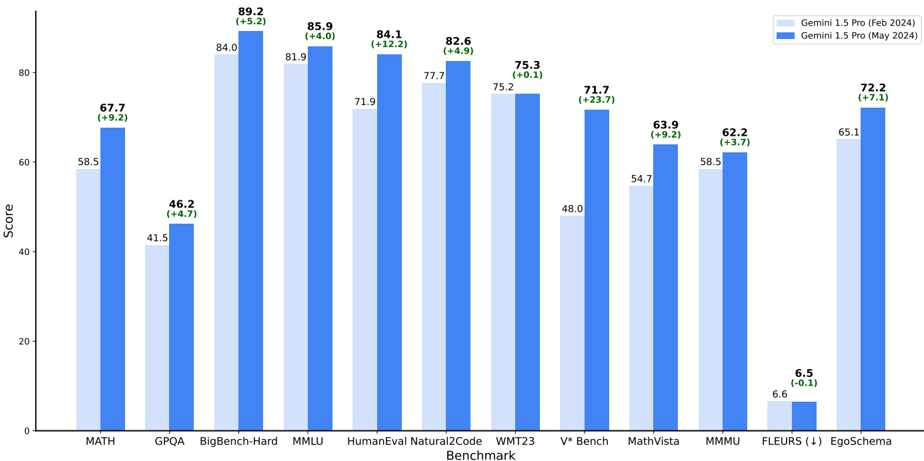
This image is a grouped bar chart comparing the performance scores of two versions of the Gemini 1.5 Pro model across 11 different benchmarks. The two versions are labeled "Gemini 1.5 Pro (Feb 2024)" and "Gemini 1.5 Pro (May 2024)". The chart visually demonstrates the performance change between the February and May 2024 releases for each benchmark.
### Components/Axes
* **Chart Type:** Grouped Bar Chart.
* **X-Axis (Horizontal):** Labeled "Benchmark". It lists 11 distinct benchmark categories. From left to right: `MATH`, `GPQA`, `BigBench-Hard`, `MMLU`, `HumanEval`, `Natural2Code`, `WMT23`, `V* Bench`, `MathVista`, `MMMU`, `FLEURS (↓)`, `EgoSchema`.
* **Y-Axis (Vertical):** Labeled "Score". It has a linear scale ranging from 0 to 80, with major tick marks at intervals of 20 (0, 20, 40, 60, 80).
* **Legend:** Located in the top-right corner of the chart area.
* A light blue square corresponds to "Gemini 1.5 Pro (Feb 2024)".
* A dark blue square corresponds to "Gemini 1.5 Pro (May 2024)".
* **Data Labels:** Each bar has its exact score printed directly above it. For the dark blue (May 2024) bars, an additional value in parentheses indicates the change from the February score (e.g., `(+5.2)`).
### Detailed Analysis
The chart presents paired data for each benchmark. The left bar (light blue) is the February 2024 score, and the right bar (dark blue) is the May 2024 score. The change is calculated as May Score minus Feb Score.
1. **MATH:** Feb: 58.5, May: 67.7 (Change: +9.2)
2. **GPQA:** Feb: 41.5, May: 46.2 (Change: +4.7)
3. **BigBench-Hard:** Feb: 84.0, May: 89.2 (Change: +5.2)
4. **MMLU:** Feb: 81.9, May: 85.9 (Change: +4.0)
5. **HumanEval:** Feb: 71.9, May: 84.1 (Change: +12.2)
6. **Natural2Code:** Feb: 77.7, May: 82.6 (Change: +4.9)
7. **WMT23:** Feb: 75.2, May: 75.3 (Change: +0.1)
8. **V* Bench:** Feb: 48.0, May: 71.7 (Change: +23.7)
9. **MathVista:** Feb: 54.7, May: 63.9 (Change: +9.2)
10. **MMMU:** Feb: 58.5, May: 62.2 (Change: +3.7)
11. **FLEURS (↓):** Feb: 6.6, May: 6.5 (Change: -0.1). The "(↓)" symbol next to the benchmark name likely indicates that a lower score is better for this specific task.
12. **EgoSchema:** Feb: 65.1, May: 72.2 (Change: +7.1)
### Key Observations
* **Universal Improvement:** The May 2024 model version shows a higher score than the February 2024 version in 10 out of 11 benchmarks.
* **Largest Gain:** The most significant performance increase is on the `V* Bench` benchmark, with a +23.7 point improvement.
* **Smallest Gain:** The smallest positive change is on `WMT23`, with a marginal +0.1 point increase.
* **Single Decrease:** The only benchmark where the score decreased is `FLEURS`, with a -0.1 point change. Given the "(↓)" notation, this minor decrease may represent a slight improvement or be within the margin of error.
* **High Baseline Scores:** Both model versions achieve their highest scores on `BigBench-Hard` (84.0 and 89.2) and `MMLU` (81.9 and 85.9).
* **Low Baseline Scores:** The lowest scores for both versions are on `FLEURS` (6.6 and 6.5) and `GPQA` (41.5 and 46.2).
### Interpretation
The data strongly suggests that the Gemini 1.5 Pro model underwent meaningful capability enhancements between its February and May 2024 releases. The improvements are broad-based, spanning mathematical reasoning (`MATH`, `MathVista`), general knowledge (`MMLU`, `BigBench-Hard`), coding (`HumanEval`, `Natural2Code`), and multimodal understanding (`V* Bench`, `MMMU`, `EgoSchema`).
The dramatic +23.7 point leap on `V* Bench` is particularly noteworthy, indicating a major advancement in the model's visual or video understanding capabilities, which is a core feature of the Gemini 1.5 Pro architecture. The near-negligible change on `WMT23` (a machine translation benchmark) suggests that the model's translation proficiency was already highly refined in February and saw only incremental gains.
The slight decrease on `FLEURS` (a speech processing benchmark) is an interesting anomaly. It could indicate a trade-off in optimization, a difference in evaluation methodology, or simply statistical noise, given the very small magnitude of the change. The "(↓)" symbol is critical context, confirming that for this specific task, a lower score is the desired outcome, making the -0.1 change potentially a minor improvement.
Overall, the chart serves as a technical demonstration of iterative model improvement, highlighting targeted advancements in complex reasoning and multimodal tasks over a three-month development cycle.