## Heatmap: Attention and MLP Weights
### Overview
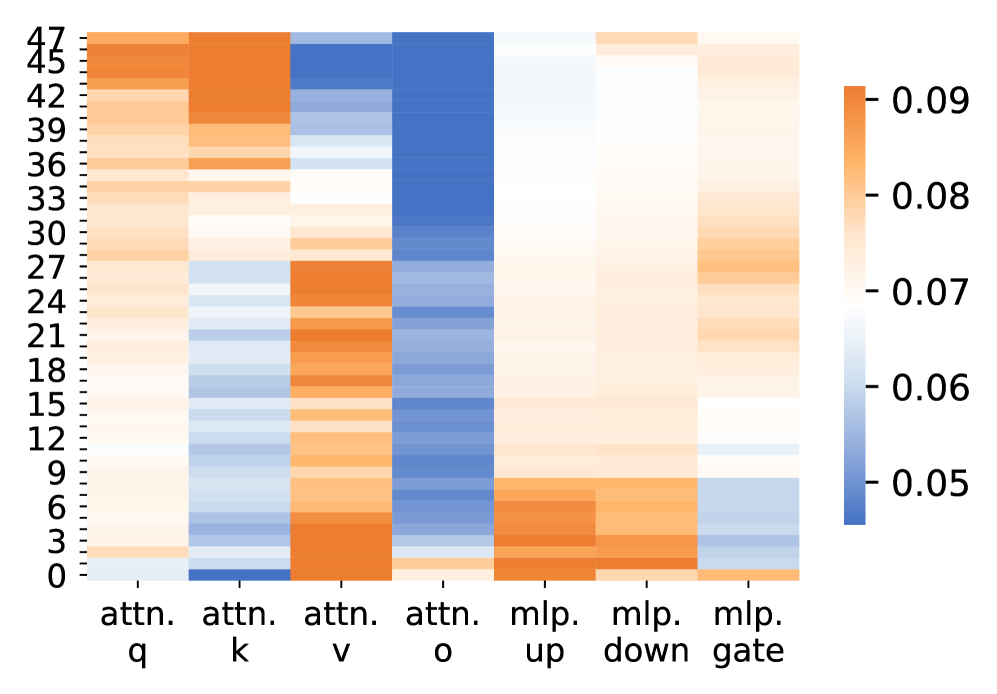
The image is a heatmap visualizing the weights associated with different components of an attention mechanism and a multilayer perceptron (MLP). The heatmap displays the magnitude of these weights using a color gradient, where darker orange represents higher values (close to 0.09) and darker blue represents lower values (close to 0.05). The x-axis represents different components (attention query, key, value, output, and MLP layers), while the y-axis represents indices ranging from 0 to 47.
### Components/Axes
* **X-axis:**
* attn. q (Attention Query)
* attn. k (Attention Key)
* attn. v (Attention Value)
* attn. o (Attention Output)
* mlp. up (MLP Up)
* mlp. down (MLP Down)
* mlp. gate (MLP Gate)
* **Y-axis:** Numerical indices from 0 to 47, incrementing by 3 (0, 3, 6, 9, 12, 15, 18, 21, 24, 27, 30, 33, 36, 39, 42, 45, 47).
* **Color Legend:** Located on the right side of the heatmap.
* Dark Orange: 0.09
* Orange: 0.08
* Light Orange: 0.07
* Light Blue: 0.06
* Dark Blue: 0.05
### Detailed Analysis
The heatmap displays the weight distribution across different components.
* **attn. q (Attention Query):** The weights are generally in the orange range (0.07-0.09), indicating relatively high values. There are some variations, with a few rows showing slightly lower values (lighter orange).
* **attn. k (Attention Key):** Similar to the query, the key also shows predominantly orange values (0.07-0.09), with some rows exhibiting slightly lower values (lighter orange).
* **attn. v (Attention Value):** The weights are mostly in the orange range (0.07-0.09), indicating relatively high values.
* **attn. o (Attention Output):** The weights are predominantly in the blue range (0.05-0.06), indicating relatively low values.
* **mlp. up (MLP Up):** The weights are mostly in the light orange range (0.07), indicating medium values.
* **mlp. down (MLP Down):** The weights are mostly in the light orange range (0.07), indicating medium values.
* **mlp. gate (MLP Gate):** The weights are mostly in the light orange range (0.07), indicating medium values.
### Key Observations
* The attention query, key, and value components have relatively high weights compared to the attention output.
* The MLP components (up, down, gate) have intermediate weight values.
* There is a clear distinction in weight distribution between the attention components and the MLP components.
### Interpretation
The heatmap provides insights into the relative importance of different components within the attention mechanism and the MLP. The higher weights associated with the attention query, key, and value suggest that these components play a more significant role in the model's performance compared to the attention output. The intermediate weights of the MLP components indicate their contribution to the overall model, but to a lesser extent than the attention's query, key, and value. The heatmap can be used to identify potential areas for optimization or further investigation, such as exploring the reasons for the lower weights in the attention output or analyzing the specific roles of the MLP components.