## Line Graph: Performance Comparison of Baselines and Models
### Overview
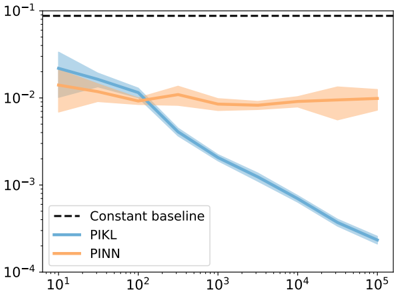
The image is a logarithmic line graph comparing three performance metrics across a range of input values (x-axis: 10¹ to 10⁵). The y-axis represents a normalized metric (10⁻¹ to 10⁻⁴). Three lines are plotted: a constant baseline (dashed black), PIKL baseline (solid blue), and PINN (solid orange), with shaded regions indicating uncertainty.
### Components/Axes
- **Y-axis**: Logarithmic scale labeled 10⁻¹ (top) to 10⁻⁴ (bottom), with gridlines at 10⁻² and 10⁻³.
- **X-axis**: Logarithmic scale labeled 10¹ (left) to 10⁵ (right), with gridlines at 10², 10³, 10⁴.
- **Legend**: Positioned at the bottom-left corner, with three entries:
- Dashed black: "Constant baseline"
- Solid blue: "PIKL baseline"
- Solid orange: "PINN"
- **Shaded Regions**: Light blue (PIKL) and light orange (PINN) bands around the lines, representing uncertainty.
### Detailed Analysis
1. **Constant Baseline (Dashed Black)**:
- Horizontal line at y = 10⁻² (0.01) across all x-values.
- No variation or uncertainty shading.
2. **PIKL Baseline (Solid Blue)**:
- Starts at ~10⁻¹.⁵ (≈3×10⁻²) at x = 10¹.
- Declines steeply, crossing the PINN line near x = 10².
- Continues declining to ~10⁻³.⁵ (≈3×10⁻⁴) at x = 10⁵.
- Shaded region widens at lower x-values, narrowing as x increases.
3. **PINN (Solid Orange)**:
- Starts at ~10⁻².⁵ (≈3×10⁻³) at x = 10¹.
- Rises slightly to ~10⁻² at x = 10², then plateaus.
- Remains above the PIKL line after x = 10².
- Shaded region is narrower than PIKL’s, indicating lower uncertainty.
### Key Observations
- **Crossover Point**: PIKL and PINN intersect near x = 10², after which PINN outperforms PIKL.
- **Uncertainty**: PIKL’s uncertainty is higher at lower x-values (10¹–10²) but decreases as x increases.
- **Baseline Stability**: The constant baseline remains unchanged, serving as a reference for relative performance.
### Interpretation
The graph demonstrates that PINN outperforms the PIKL baseline for x > 10², suggesting improved performance or stability at higher input scales. The constant baseline (10⁻²) may represent a theoretical or empirical threshold. The narrowing uncertainty bands for both models at higher x-values imply increased confidence in their predictions as input magnitude grows. This could indicate that PINN is better suited for high-scale applications, while PIKL’s variability at lower scales might limit its reliability. The constant baseline’s fixed value highlights a potential target or benchmark for both models.