TECHNICAL ASSET FINGERPRINT
d7871120ca208c28f9b7c5a1
Click to view fullscreen
Press ESC or click to close
FOUND IN PAPERS
EXPERT: gemma-3-27b-it-free VERSION 1
RUNTIME: google-free/gemma-3-27b-it
INTEL_VERIFIED
\n
## Charts: Precision-Recall Curves for Different Models
### Overview
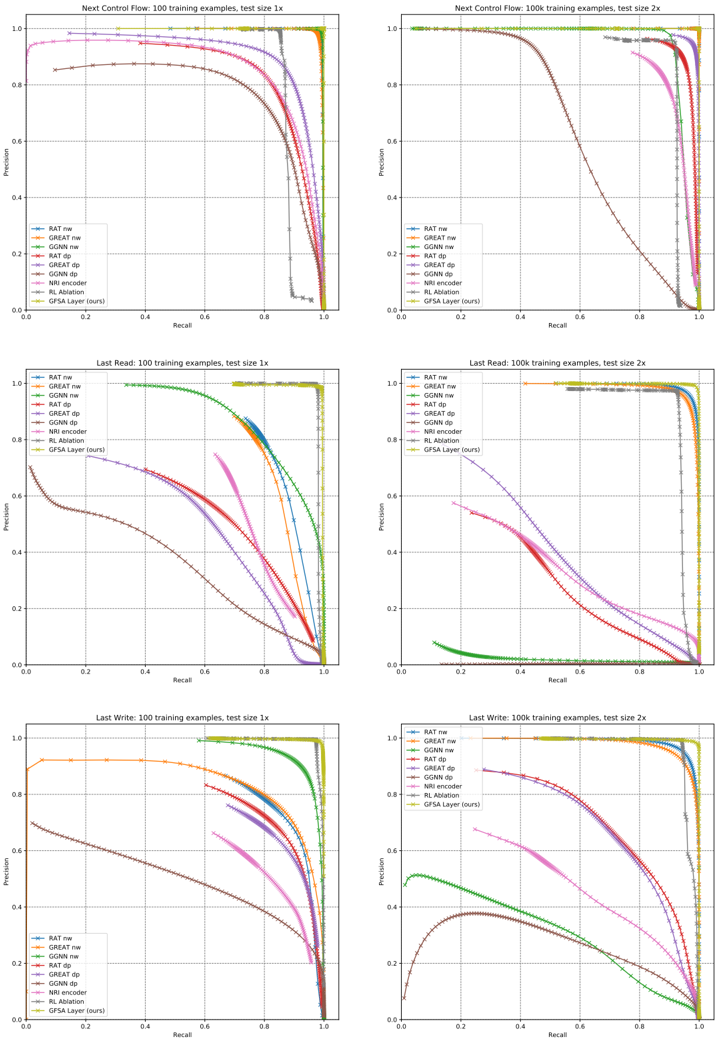
The image contains six precision-recall curves, arranged in a 2x3 grid. Each chart visualizes the performance of different models (RAT, GNAT, GCNN, etc.) under varying conditions (training examples and test size). The charts compare the precision and recall rates of these models.
### Components/Axes
Each chart shares the following components:
* **X-axis:** Recall, ranging from 0.0 to 1.0.
* **Y-axis:** Precision, ranging from 0.0 to 1.0.
* **Title:** Indicates the task (Next Control Flow, Last Read, Last Write), the training example count (100), and the test size (1x or 2x).
* **Legend:** Located in the bottom-left corner, identifying each data series by model name and color. The models are:
* RAT_nw (Dark Blue)
* GNAT_nw (Red)
* GCNN_nw (Green)
* GNAT_dp (Magenta)
* RAT_dp (Cyan)
* GCNN_dp (Yellow)
* NRI encoder (Light Blue)
* RL Adaption (Orange)
* GFSA Layer (tours) (Purple)
### Detailed Analysis or Content Details
**Chart 1: Next Control Flow, 100 training examples, test size 1x**
* **RAT_nw (Dark Blue):** Line slopes upward sharply, reaching a precision of approximately 0.95 at a recall of around 0.1, then plateaus.
* **GNAT_nw (Red):** Line starts at approximately 0.1 precision at 0.0 recall, rises to a peak precision of approximately 0.85 at a recall of around 0.2, then declines.
* **GCNN_nw (Green):** Line starts at approximately 0.1 precision at 0.0 recall, rises to a peak precision of approximately 0.75 at a recall of around 0.3, then declines.
* **GNAT_dp (Magenta):** Line starts at approximately 0.1 precision at 0.0 recall, rises to a peak precision of approximately 0.7 at a recall of around 0.3, then declines.
* **RAT_dp (Cyan):** Line starts at approximately 0.1 precision at 0.0 recall, rises to a peak precision of approximately 0.6 at a recall of around 0.4, then declines.
* **GCNN_dp (Yellow):** Line starts at approximately 0.1 precision at 0.0 recall, rises to a peak precision of approximately 0.5 at a recall of around 0.5, then declines.
* **NRI encoder (Light Blue):** Line is relatively flat, with a precision of approximately 0.1 across all recall values.
* **RL Adaption (Orange):** Line is relatively flat, with a precision of approximately 0.1 across all recall values.
* **GFSA Layer (tours) (Purple):** Line is relatively flat, with a precision of approximately 0.1 across all recall values.
**Chart 2: Next Control Flow, 100 training examples, test size 2x**
* Similar trends to Chart 1, but generally lower precision values across all models.
**Chart 3: Last Read, 100 training examples, test size 1x**
* **RAT_nw (Dark Blue):** Line slopes upward sharply, reaching a precision of approximately 0.95 at a recall of around 0.1, then plateaus.
* **GNAT_nw (Red):** Line starts at approximately 0.1 precision at 0.0 recall, rises to a peak precision of approximately 0.85 at a recall of around 0.2, then declines.
* **GCNN_nw (Green):** Line starts at approximately 0.1 precision at 0.0 recall, rises to a peak precision of approximately 0.75 at a recall of around 0.3, then declines.
* **GNAT_dp (Magenta):** Line starts at approximately 0.1 precision at 0.0 recall, rises to a peak precision of approximately 0.7 at a recall of around 0.3, then declines.
* **RAT_dp (Cyan):** Line starts at approximately 0.1 precision at 0.0 recall, rises to a peak precision of approximately 0.6 at a recall of around 0.4, then declines.
* **GCNN_dp (Yellow):** Line starts at approximately 0.1 precision at 0.0 recall, rises to a peak precision of approximately 0.5 at a recall of around 0.5, then declines.
* **NRI encoder (Light Blue):** Line is relatively flat, with a precision of approximately 0.1 across all recall values.
* **RL Adaption (Orange):** Line is relatively flat, with a precision of approximately 0.1 across all recall values.
* **GFSA Layer (tours) (Purple):** Line is relatively flat, with a precision of approximately 0.1 across all recall values.
**Chart 4: Last Read, 100 training examples, test size 2x**
* Similar trends to Chart 3, but generally lower precision values across all models.
**Chart 5: Last Write, 100 training examples, test size 1x**
* **RAT_nw (Dark Blue):** Line slopes upward sharply, reaching a precision of approximately 0.95 at a recall of around 0.1, then plateaus.
* **GNAT_nw (Red):** Line starts at approximately 0.1 precision at 0.0 recall, rises to a peak precision of approximately 0.85 at a recall of around 0.2, then declines.
* **GCNN_nw (Green):** Line starts at approximately 0.1 precision at 0.0 recall, rises to a peak precision of approximately 0.75 at a recall of around 0.3, then declines.
* **GNAT_dp (Magenta):** Line starts at approximately 0.1 precision at 0.0 recall, rises to a peak precision of approximately 0.7 at a recall of around 0.3, then declines.
* **RAT_dp (Cyan):** Line starts at approximately 0.1 precision at 0.0 recall, rises to a peak precision of approximately 0.6 at a recall of around 0.4, then declines.
* **GCNN_dp (Yellow):** Line starts at approximately 0.1 precision at 0.0 recall, rises to a peak precision of approximately 0.5 at a recall of around 0.5, then declines.
* **NRI encoder (Light Blue):** Line is relatively flat, with a precision of approximately 0.1 across all recall values.
* **RL Adaption (Orange):** Line is relatively flat, with a precision of approximately 0.1 across all recall values.
* **GFSA Layer (tours) (Purple):** Line is relatively flat, with a precision of approximately 0.1 across all recall values.
**Chart 6: Last Write, 100 training examples, test size 2x**
* Similar trends to Chart 5, but generally lower precision values across all models.
### Key Observations
* **RAT_nw consistently outperforms other models** across all tasks and test sizes, achieving the highest precision at low recall values.
* **GNAT_nw and GCNN_nw show similar performance**, with GNAT_nw generally slightly better.
* **The "dp" variants (GNAT_dp, RAT_dp, GCNN_dp) consistently underperform their "nw" counterparts.**
* **NRI encoder, RL Adaption, and GFSA Layer (tours) exhibit very low precision** across all recall values, indicating poor performance.
* **Increasing the test size (from 1x to 2x) generally leads to a decrease in precision** for all models.
### Interpretation
The data suggests that the RAT_nw model is the most effective for the tasks of Next Control Flow prediction, Last Read identification, and Last Write identification, particularly when tested on smaller datasets (test size 1x). The performance of all models degrades when tested on larger datasets (test size 2x), indicating potential overfitting or generalization issues. The consistently poor performance of the NRI encoder, RL Adaption, and GFSA Layer (tours) suggests that these models are not well-suited for these tasks, or require further optimization. The difference in performance between the "nw" and "dp" variants suggests that the "nw" approach is more robust or better suited to the data distribution. The precision-recall curves provide a comprehensive view of the trade-off between precision and recall for each model, allowing for informed decisions about model selection and deployment. The consistent shape of the curves across tasks suggests that the underlying performance characteristics of the models are relatively stable.
DECODING INTELLIGENCE...