## Precision-Recall Curves: Multi-Task Model Comparison
### Overview
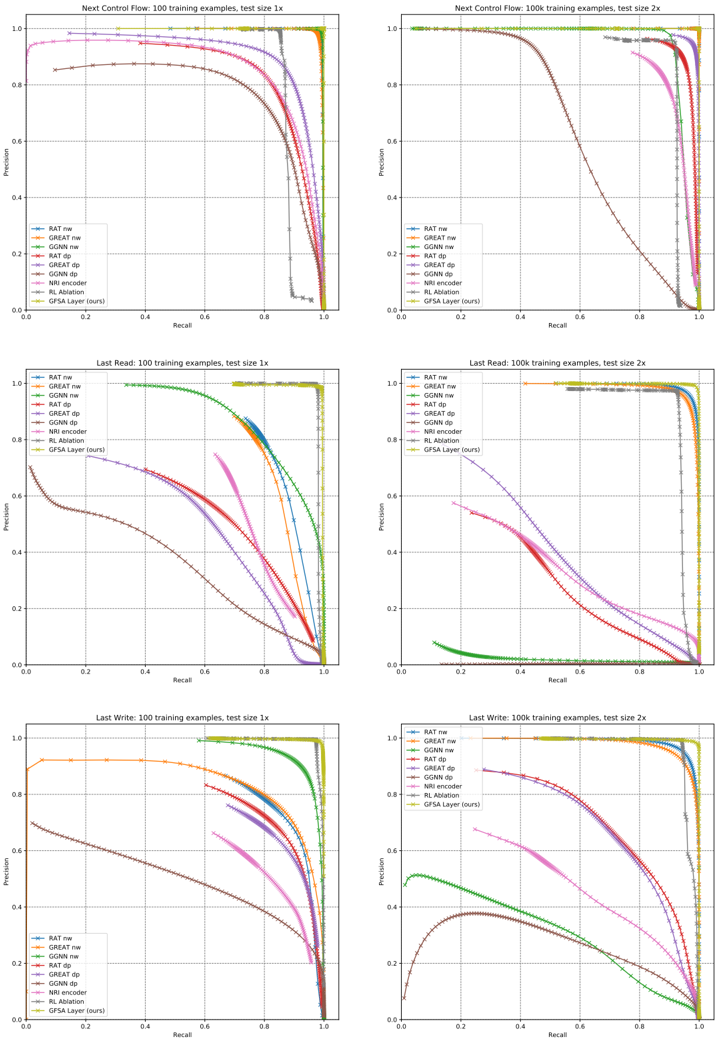
The image displays a 3x2 grid of six precision-recall curves. These curves compare the performance of nine different models on three distinct tasks ("Next Control Flow", "Last Read", "Last Write") under two training data regimes (100 examples and 100,000 examples) and two test set sizes (1x and 2x). The plots are technical evaluation charts, likely from a machine learning or program analysis research paper.
### Components/Axes
* **Plot Structure:** Six individual plots arranged in three rows and two columns.
* **Row Titles (Tasks):**
* Top Row: "Next Control Flow"
* Middle Row: "Last Read"
* Bottom Row: "Last Write"
* **Column Titles (Training/Test Conditions):**
* Left Column: "100 training examples, test size 1x"
* Right Column: "100k training examples, test size 2x"
* **Axes (Identical for all plots):**
* **X-axis:** "Recall" (ranging from 0.0 to 1.0)
* **Y-axis:** "Precision" (ranging from 0.0 to 1.0)
* **Legend (Present in each plot, bottom-left corner):**
* `RAT ne` (Blue line with circle markers)
* `GREAT ne` (Orange line with square markers)
* `GGNN ne` (Green line with upward-pointing triangle markers)
* `RAT dp` (Red line with downward-pointing triangle markers)
* `GREAT dp` (Purple line with diamond markers)
* `GGNN dp` (Brown line with left-pointing triangle markers)
* `NRI encoder` (Pink line with right-pointing triangle markers)
* `NRI decoder` (Gray line with plus markers)
* `GSA Layer (ours)` (Yellow-green line with star markers)
### Detailed Analysis
**Row 1: Next Control Flow**
* **Left Plot (100 ex, 1x test):** Most models maintain high precision (>0.8) until recall ~0.8, then drop sharply. `GSA Layer (ours)` and `GGNN ne` are top performers, maintaining near-perfect precision until recall ~0.95. `NRI decoder` performs worst, dropping below 0.8 precision at recall ~0.6.
* **Right Plot (100k ex, 2x test):** Performance is generally higher and more clustered. `GSA Layer (ours)`, `GGNN ne`, `RAT ne`, and `GREAT ne` all maintain precision >0.9 until recall >0.9. `NRI decoder` and `GGNN dp` show the earliest and steepest declines.
**Row 2: Last Read**
* **Left Plot (100 ex, 1x test):** Significant performance spread. `GGNN ne` is the clear leader, maintaining high precision across almost the entire recall range. `GSA Layer (ours)` is second-best. `NRI decoder` and `GGNN dp` perform poorly, with precision dropping below 0.6 at recall ~0.4.
* **Right Plot (100k ex, 2x test):** `GGNN ne` and `GSA Layer (ours)` dominate, showing near-perfect performance (precision ~1.0 until recall ~0.95). `RAT ne` and `GREAT ne` are strong seconds. `NRI decoder` and `GGNN dp` remain the lowest performers, with curves starting at lower precision.
**Row 3: Last Write**
* **Left Plot (100 ex, 1x test):** `GGNN ne` and `GSA Layer (ours)` are again top performers. `GREAT ne` shows a unique, nearly flat high-precision plateau until recall ~0.9. `NRI decoder` performs very poorly, with precision starting below 0.7.
* **Right Plot (100k ex, 2x test):** `GSA Layer (ours)` and `GGNN ne` lead. `RAT ne` and `GREAT ne` are close behind. `GGNN dp` shows a distinct arch shape, peaking at ~0.5 precision. `NRI decoder` has the lowest curve.
### Key Observations
1. **Consistent Top Performers:** The `GSA Layer (ours)` and `GGNN ne` models are consistently among the top two performers across all tasks and data regimes.
2. **Impact of Training Data:** Moving from 100 to 100k training examples (left to right columns) dramatically improves performance for most models, compressing the high-performance curves toward the top-right corner.
3. **Consistent Underperformer:** The `NRI decoder` model is consistently the worst or among the worst performers in every scenario.
4. **Task Difficulty:** The "Last Read" task (middle row) shows the greatest performance disparity between models, especially with limited training data (left plot), suggesting it may be the most challenging or discriminative task.
5. **Model Variant Trends:** The `ne` (node embedding?) variants of models (`RAT ne`, `GREAT ne`, `GGNN ne`) generally outperform their `dp` (message passing?) counterparts (`RAT dp`, `GREAT dp`, `GGNN dp`).
### Interpretation
This set of charts provides a comprehensive benchmark of graph neural network (GNN) and related architectures for program analysis tasks. The data suggests that the proposed `GSA Layer` model is highly effective and robust, matching or exceeding the performance of strong baselines like `GGNN ne` across diverse scenarios.
The dramatic improvement with more training data (100k vs. 100 examples) highlights the data-hungry nature of these models. The persistent poor performance of the `NRI decoder` indicates it may be ill-suited for these specific program analysis tasks compared to the other architectures tested.
The "Last Read" task's high variance in model performance with low data suggests it relies on more complex or subtle program features that some models (`GGNN ne`, `GSA Layer`) are better at capturing from few examples. The consistent ranking of models across tasks implies that architectural strengths are generalizable rather than task-specific. The charts effectively argue for the efficacy of the `GSA Layer` approach within this experimental framework.