## Diagram: BELM-MDCM Module Workflow
### Overview
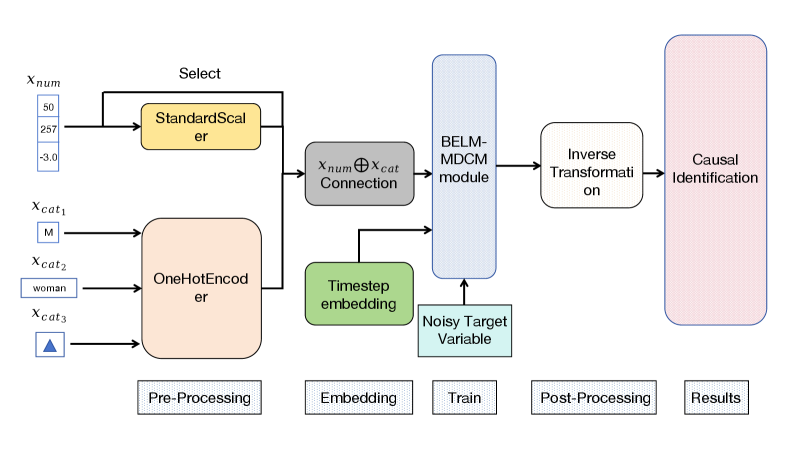
The image is a diagram illustrating the workflow of a BELM-MDCM (Bayesian Explanatory Learning Machine - Multi-Dimensional Causal Modeling) module. It shows the steps involved in processing numerical and categorical input data, embedding, training, post-processing, and ultimately, causal identification.
### Components/Axes
The diagram is structured horizontally, showing the flow of data from left to right through several stages:
* **Input Data:**
* `Xnum`: Numerical input data, with example values 50, 257, and -3.0.
* `Xcat1`: Categorical input 1, with example value "M".
* `Xcat2`: Categorical input 2, with example value "woman".
* `Xcat3`: Categorical input 3, with an example value of a blue triangle.
* **Pre-Processing:**
* `StandardScaler`: A yellow box representing the standardization of numerical data.
* `OneHotEncoder`: A peach-colored box representing the one-hot encoding of categorical data.
* **Embedding:**
* `Xnum ⊕ Xcat Connection`: A gray box representing the connection of numerical and categorical data.
* `Timestep embedding`: A green box representing timestep embedding.
* **Train:**
* `BELM-MDCM module`: A light blue box representing the core module.
* `Noisy Target Variable`: A light blue box representing the noisy target variable.
* **Post-Processing:**
* `Inverse Transformation`: A white box representing the inverse transformation.
* **Results:**
* `Causal Identification`: A pink box representing the final causal identification step.
Below each stage, there is a label indicating the process: "Pre-Processing", "Embedding", "Train", "Post-Processing", and "Results".
At the top, there is a label "Select" above the Pre-Processing stage.
### Detailed Analysis
* **Numerical Data (`Xnum`):** The numerical data consists of three example values: 50, 257, and -3.0. These values are fed into the `StandardScaler` for normalization.
* **Categorical Data (`Xcat1`, `Xcat2`, `Xcat3`):** The categorical data consists of three categories with example values: "M", "woman", and a blue triangle. These values are fed into the `OneHotEncoder` to convert them into a numerical format suitable for the model.
* **Data Connection (`Xnum ⊕ Xcat Connection`):** The standardized numerical data and the one-hot encoded categorical data are combined in the "Connection" step.
* **BELM-MDCM Module:** The combined data, along with the timestep embedding and noisy target variable, are fed into the `BELM-MDCM module` for training.
* **Inverse Transformation:** After training, an inverse transformation is applied.
* **Causal Identification:** Finally, the model performs causal identification to produce the results.
### Key Observations
* The diagram illustrates a clear flow of data from input to output.
* The `BELM-MDCM module` is the central component of the workflow.
* Pre-processing steps are crucial for preparing the data for the model.
### Interpretation
The diagram provides a high-level overview of the `BELM-MDCM module` workflow. It shows how numerical and categorical data are pre-processed, combined, and used to train the model for causal identification. The diagram highlights the importance of each stage in the process, from data input to final results. The use of `StandardScaler` and `OneHotEncoder` suggests that the model can handle both numerical and categorical data types. The inclusion of "Timestep embedding" indicates that the model is likely designed to handle time-series data or sequential information. The "Noisy Target Variable" suggests that the model is robust to noise in the target variable.