\n
## Diagram: BELM-MDCM Workflow
### Overview
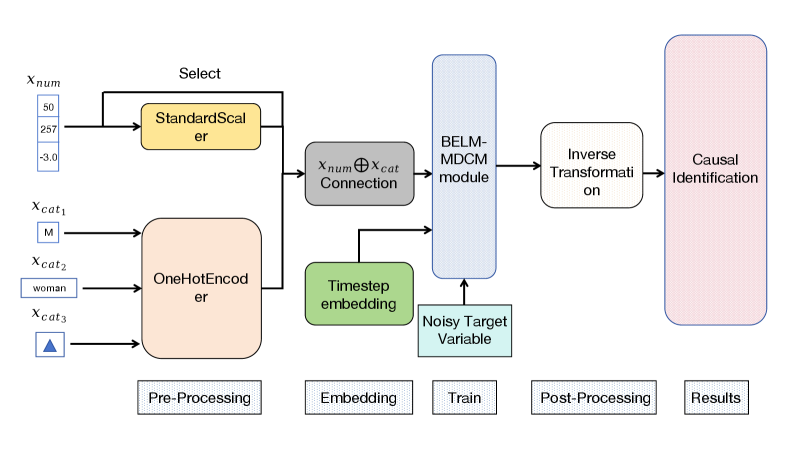
This diagram illustrates the workflow of a BELM-MDCM (likely a Bayesian Evidence Learning Model - Multi-Dimensional Causal Model) system. It depicts the data flow through several stages: Pre-Processing, Embedding, Train, Post-Processing, and Results. The diagram highlights the different modules and connections between them, along with example input data.
### Components/Axes
The diagram is segmented into five main sections, labeled at the bottom:
1. **Pre-Processing:** Includes `StandardScaler` and `OneHotEncoder`.
2. **Embedding:** Includes `Timestep embedding` and `x_num ⊗ x_cat Connection`.
3. **Train:** Includes `BELM-MDCM module` and `Noisy Target Variable`.
4. **Post-Processing:** Includes `Inverse Transformation`.
5. **Results:** Includes `Causal Identification`.
Input variables are shown on the left side:
* `x_num`: Numerical input with example values 50, 257, -3.0.
* `x_cat1`: Categorical input with example value "M".
* `x_cat2`: Categorical input with example value "woman".
* `x_cat3`: Categorical input with example value represented by a triangle symbol.
### Detailed Analysis or Content Details
* **Pre-Processing:**
* `StandardScaler`: Receives `x_num` as input. The block is yellow.
* `OneHotEncoder`: Receives `x_cat1`, `x_cat2`, and `x_cat3` as input. The block is yellow.
* **Embedding:**
* `x_num ⊗ x_cat Connection`: Receives output from `StandardScaler` and `OneHotEncoder`. The block is light blue.
* `Timestep embedding`: Receives input from `x_num ⊗ x_cat Connection`. The block is light blue.
* **Train:**
* `BELM-MDCM module`: Receives input from `Timestep embedding` and `Noisy Target Variable`. The block is a large light blue rectangle.
* `Noisy Target Variable`: Input to the `BELM-MDCM module`. The block is light blue.
* **Post-Processing:**
* `Inverse Transformation`: Receives output from `BELM-MDCM module`. The block is light blue.
* **Results:**
* `Causal Identification`: Receives output from `Inverse Transformation`. The block is pink.
The arrows indicate the direction of data flow. The diagram shows a sequential process, starting with data pre-processing, followed by embedding, training, post-processing, and finally, causal identification.
### Key Observations
The diagram emphasizes the integration of numerical and categorical data through the `x_num ⊗ x_cat Connection`. The `BELM-MDCM module` appears to be the core of the system, receiving inputs from both the embedding stage and a `Noisy Target Variable`. The final stage focuses on extracting causal relationships from the processed data.
### Interpretation
The diagram represents a machine learning pipeline designed for causal inference. The pre-processing steps prepare the data for the model. The embedding stage transforms the data into a suitable representation for the `BELM-MDCM module`. The inclusion of a "Noisy Target Variable" suggests the model is designed to handle uncertainty or imperfect data. The final stages aim to identify causal relationships, which is a complex task often requiring sophisticated modeling techniques. The use of "Inverse Transformation" suggests the model may be operating in a latent space and requires a transformation back to the original data space for interpretation. The diagram provides a high-level overview of the system's architecture and data flow, but does not provide details about the specific algorithms or parameters used in each module.