## Diagram: Parallel Process Flowchart with Conditional Branching
### Overview
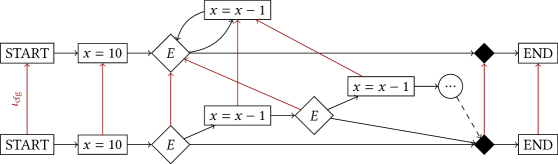
The image displays a technical flowchart diagram illustrating two parallel, similar process flows. Each flow begins with a "START" node, initializes a variable `x` to 10, passes through a decision point labeled "E", undergoes one or more decrement operations (`x = x - 1`), and terminates at an "END" node. The diagram uses black and red lines to differentiate between two distinct execution paths or conditions within each parallel flow. A dashed line with an ellipsis suggests an omitted or iterative segment.
### Components/Axes
* **Node Types:**
* **Terminal Nodes:** Rectangles labeled "START" (left side) and "END" (right side).
* **Process Nodes:** Rectangles containing the assignment `x = 10` and `x = x - 1`.
* **Decision Nodes:** Diamond shapes labeled with the letter "E".
* **Connector/Annotation:** A circle containing an ellipsis (`...`) connected by a dashed line.
* **Connectors (Edges):**
* **Solid Black Lines:** Represent the primary or default flow of control.
* **Solid Red Lines:** Represent an alternative or conditional flow of control.
* **Dashed Black Line:** Connects a decision node to the ellipsis circle, indicating a skipped or variable path.
* **Text Labels:**
* `START` (appears twice, top-left and bottom-left).
* `x = 10` (appears twice, immediately right of each START).
* `E` (appears four times, inside diamond-shaped decision nodes).
* `x = x - 1` (appears four times, in rectangular process nodes).
* `...` (inside a circle, right-center).
* `END` (appears twice, top-right and bottom-right).
* `t_0%` (written vertically in red, to the left of the bottom START node).
### Detailed Analysis
The diagram is structured as two parallel horizontal flows, top and bottom.
**Top Flow:**
1. **Start:** Begins at the top-left "START" node.
2. **Initialization:** Proceeds right to a process node setting `x = 10`.
3. **First Decision:** Enters a diamond decision node labeled "E".
* **Black Path (Default):** Exits the right point of the diamond, travels horizontally to the right, and connects directly to the top "END" node.
* **Red Path (Conditional):** Exits the top point of the diamond, curves upward and right to a process node (`x = x - 1`), then continues right and down to connect to the top "END" node.
4. **End:** Terminates at the top-right "END" node.
**Bottom Flow:**
1. **Start:** Begins at the bottom-left "START" node. The annotation `t_0%` is positioned vertically to its left.
2. **Initialization:** Proceeds right to a process node setting `x = 10`.
3. **First Decision:** Enters a diamond decision node labeled "E".
* **Black Path (Default):** Exits the right point of the diamond, travels right to a second process node (`x = x - 1`), then to a second "E" decision node.
* From this second "E", the black path exits right, goes to another `x = x - 1` node, then to a circle with `...`, and finally via a dashed line to the bottom "END" node.
* **Red Path (Conditional):** Exits the top point of the first "E" diamond, travels upward to connect to the `x = x - 1` node in the *top* flow's red path. This creates a cross-connection between the two parallel flows.
4. **End:** Terminates at the bottom-right "END" node.
### Key Observations
1. **Cross-Flow Connection:** The most notable feature is the red line connecting the first decision ("E") of the bottom flow to a process step in the top flow. This indicates that a condition in the bottom process can trigger an action within the top process.
2. **Path Complexity:** The bottom flow is more complex, featuring a second decision node ("E") and an ellipsis (`...`) suggesting an iterative or undefined number of subsequent steps.
3. **Color-Coded Logic:** Red lines consistently denote a path that involves the `x = x - 1` operation before reaching the end, while the black line from the first decision in the top flow bypasses any decrement.
4. **Spatial Layout:** The two flows are aligned horizontally. The legend (implied by line color) is integrated directly into the diagram's flow rather than placed in a separate box. The `t_0%` annotation is uniquely placed and colored, possibly indicating a time or threshold parameter for the bottom process.
### Interpretation
This diagram likely models a concurrent or parallel algorithm where two processes share an initial state (`x=10`) and have decision points ("E") that can influence each other. The "E" probably stands for an "Event," "Evaluation," or "Error" check.
* **What it demonstrates:** It shows how a single condition (the red path from the bottom "E") can have a side effect on a separate process (triggering a decrement in the top flow). The top flow has a simple "fast path" (black) and a "decrement path" (red). The bottom flow is more complex, with potential for multiple decrements (suggested by the ellipsis) and can also trigger the top flow's decrement.
* **Relationships:** The processes are not independent; they are coupled through the shared conditional logic represented by the red cross-connection. The state of variable `x` is central to both.
* **Anomalies/Notable Points:** The `t_0%` label is ambiguous without context but may represent a time-based trigger or a probability threshold for the bottom process's initial decision. The dashed line to the ellipsis indicates an abstracted or variable-length sequence of operations, which is a key detail for understanding the full scope of the bottom process. The diagram effectively visualizes inter-process communication or shared state management in a system.