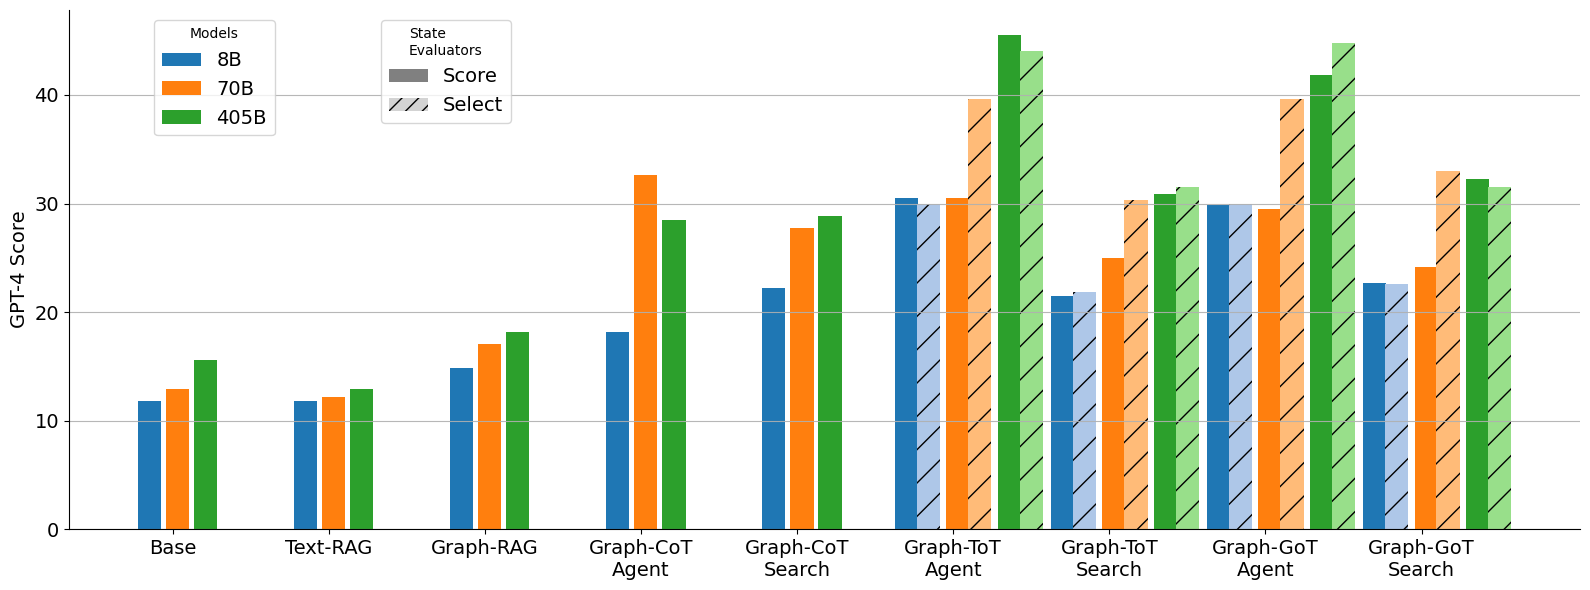
## Bar Chart: GPT-4 Score vs. Models & State Evaluators
### Overview
This bar chart compares the GPT-4 scores of different models (8B, 70B, and 405B) across various state evaluators: Base, Text-RAG, Graph-RAG, Graph-CoT Agent, Graph-CoT Search, Graph-ToT Agent, and Graph-GoT Search. Each state evaluator has three bars representing the performance of each model. The chart uses a grouped bar format to facilitate comparison.
### Components/Axes
* **X-axis:** State Evaluators - Base, Text-RAG, Graph-RAG, Graph-CoT Agent, Graph-CoT Search, Graph-ToT Agent, Graph-GoT Search.
* **Y-axis:** GPT-4 Score (Scale from 0 to 40, increments of 10).
* **Legend:**
* Models:
* 8B (Blue)
* 70B (Orange)
* 405B (Green)
* State Evaluators:
* Score (Solid bars)
* Select (Hatched bars) - *Note: The "Select" bars are not consistently present across all state evaluators.*
### Detailed Analysis
The chart presents GPT-4 scores for each model and state evaluator combination. The following data points are extracted, with approximate values due to the visual nature of the chart:
* **Base:**
* 8B: ~13
* 70B: ~15
* 405B: ~17
* **Text-RAG:**
* 8B: ~17
* 70B: ~22
* 405B: ~26
* **Graph-RAG:**
* 8B: ~16
* 70B: ~21
* 405B: ~23
* **Graph-CoT Agent:**
* 8B: ~24
* 70B: ~32
* 405B: ~31
* **Graph-CoT Search:**
* 8B: ~26
* 70B: ~28
* 405B: ~32
* **Graph-ToT Agent:**
* 8B: ~28
* 70B: ~33
* 405B: ~35
* **Graph-GoT Search:**
* 8B: ~27
* 70B: ~30
* 405B: ~43
**Trends:**
* **Model Performance:** Generally, the 405B model consistently outperforms the 70B and 8B models across all state evaluators. The 70B model typically performs better than the 8B model.
* **State Evaluator Impact:** The GPT-4 scores vary significantly depending on the state evaluator used. The "Base" evaluator yields the lowest scores, while "Graph-GoT Search" generally produces the highest scores.
* **Select Bars:** The "Select" bars are present for Graph-CoT Agent, Graph-ToT Agent, and Graph-GoT Search. These bars are generally slightly lower than the corresponding "Score" bars.
### Key Observations
* The largest performance jump appears to occur when moving from the 8B to the 70B model, particularly in the Text-RAG and Graph-CoT Agent evaluators.
* The 405B model shows the most consistent high performance, with a particularly strong result in the Graph-GoT Search evaluator (~43).
* The "Select" bars suggest a potential difference in evaluation methodology or a different metric being measured, but the impact is relatively small.
### Interpretation
The data suggests that model size is a significant factor in achieving higher GPT-4 scores, with the 405B model demonstrating superior performance. The choice of state evaluator also plays a crucial role, with more sophisticated evaluators (those involving graph-based approaches like Graph-CoT, Graph-ToT, and Graph-GoT) leading to higher scores. This indicates that leveraging graph structures and reasoning capabilities can improve performance. The presence of "Select" bars implies an alternative evaluation criterion, potentially focusing on a specific aspect of model behavior, but its impact is less pronounced than the model size or evaluator type. The consistent upward trend in scores as the evaluators become more complex suggests that these evaluators are better at capturing the nuances of model performance. The outlier is the 405B model's performance on Graph-GoT Search, which is significantly higher than any other combination, indicating a particularly effective synergy between the model and this specific evaluation setup.