## Diagram: Causal Relationship Diagram
### Overview
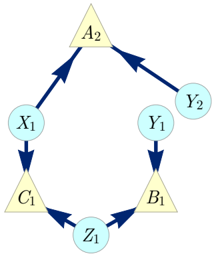
This image depicts a directed graph illustrating potential causal relationships between several nodes. The nodes are represented by circles and triangles, and the relationships are indicated by directed arrows.
### Components/Axes
There are no explicit axes or legends in this diagram. The components are:
* **Circular Nodes:** Labeled X₁, Y₁, Y₂, Z₁. These are colored light blue.
* **Triangular Nodes:** Labeled A₂, B₁, C₁. These are colored light yellow.
* **Directed Arrows:** Dark blue arrows indicating the direction of influence or causality.
### Detailed Analysis or Content Details
The diagram shows the following connections:
* An arrow points from X₁ to C₁.
* An arrow points from X₁ to A₂.
* An arrow points from Y₁ to B₁.
* An arrow points from Y₂ to A₂.
* An arrow points from B₁ to Z₁.
* An arrow points from C₁ to Z₁.
* An arrow points from Z₁ to B₁.
* An arrow points from A₂ to X₁.
### Key Observations
The diagram illustrates a cyclical relationship involving A₂, X₁, C₁, and Z₁, B₁. Specifically, A₂ influences X₁, which in turn influences C₁ and A₂. C₁ influences Z₁, and Z₁ influences B₁. B₁ influences Z₁ and is influenced by Y₁. Y₂ influences A₂.
### Interpretation
This diagram represents a system of interconnected variables where the arrows denote a directional influence or causality. The presence of cycles (e.g., A₂ -> X₁ -> A₂) suggests feedback loops within the system. The distinct shapes (circles and triangles) and colors might represent different types of variables or states within the system, though this is not explicitly defined. The diagram could be used to model a biological pathway, a social system, or a computational process where the interactions between components are crucial. The cyclical nature implies that changes in one part of the system can propagate and eventually affect the originating component, leading to potential stability or oscillation.