## Directed Graph Diagram: Cyclic Process Flow
### Overview
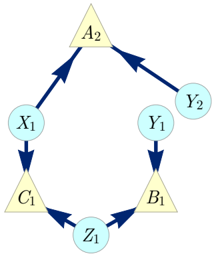
The image displays a directed graph (network diagram) consisting of seven nodes connected by directional arrows, forming a closed loop. The nodes are differentiated by shape (triangles and circles) and labeled with alphanumeric identifiers. The diagram illustrates a cyclic process or system flow.
### Components/Axes
**Nodes (Shapes and Labels):**
- **Triangles (3):**
- Top-center: `A₂` (light yellow fill)
- Bottom-left: `C₁` (light yellow fill)
- Bottom-right: `B₁` (light yellow fill)
- **Circles (4):**
- Left-middle: `X₁` (light blue fill)
- Right-middle (upper): `Y₁` (light blue fill)
- Right-middle (lower): `Y₂` (light blue fill)
- Bottom-center: `Z₁` (light blue fill)
**Connections (Directed Arrows):**
All arrows are dark blue with triangular arrowheads, indicating the direction of flow. The connections form a single continuous cycle.
### Detailed Analysis
**Flow Sequence (Traced from the arrows):**
1. `A₂` → `X₁` (Arrow points downward-left from the top triangle to the left circle)
2. `X₁` → `C₁` (Arrow points downward from the left circle to the bottom-left triangle)
3. `C₁` → `Z₁` (Arrow points downward-right from the bottom-left triangle to the bottom-center circle)
4. `Z₁` → `B₁` (Arrow points upward-right from the bottom-center circle to the bottom-right triangle)
5. `B₁` → `Y₁` (Arrow points upward from the bottom-right triangle to the upper-right circle)
6. `Y₁` → `Y₂` (Arrow points downward from the upper-right circle to the lower-right circle)
7. `Y₂` → `A₂` (Arrow points upward-left from the lower-right circle back to the top triangle, completing the cycle)
**Spatial Layout:**
- The diagram is arranged in a roughly hexagonal or circular pattern.
- `A₂` is positioned at the top apex.
- `X₁` and `Y₂`/`Y₁` form the left and right sides, respectively.
- `C₁`, `Z₁`, and `B₁` form the base.
### Key Observations
- **Cyclic Structure:** The graph is a single, unbroken cycle with no terminal nodes. Every node has exactly one incoming and one outgoing arrow.
- **Shape Differentiation:** The use of triangles (`A₂`, `C₁`, `B₁`) versus circles (`X₁`, `Y₁`, `Y₂`, `Z₁`) suggests a categorical distinction between node types (e.g., processes vs. data stores, states vs. events).
- **Labeling Convention:** Labels use a letter followed by a numerical subscript (`A₂`, `C₁`, etc.), which may denote version, instance, or sequence.
- **No External Inputs/Outputs:** The diagram depicts a closed system with no connections to external elements.
### Interpretation
This diagram models a **closed-loop process or system**. The cyclic nature implies continuous operation, feedback, or a recurring sequence.
- **Possible Meanings:** The triangles could represent **processing steps, decision points, or active states**, while the circles could represent **data packets, intermediate results, or passive states**. The flow from `A₂` through `X₁`, `C₁`, `Z₁`, `B₁`, `Y₁`, and `Y₂` back to `A₂` suggests a **control loop, a state machine, or a data transformation pipeline** where the output of the final stage (`Y₂`) feeds back into the initial stage (`A₂`).
- **Notable Pattern:** The path is not a simple circle. It has a "detour" through `Y₁` and `Y₂` on the right side, creating a sub-loop (`B₁` → `Y₁` → `Y₂` → `A₂`) within the main cycle. This could indicate a **conditional branch, a parallel subprocess, or a buffering stage** in the overall flow.
- **System Implication:** The closed loop suggests **self-sustenance or homeostasis**. Any change or perturbation at one node will propagate through the entire system and eventually return to affect the starting point, characteristic of **feedback systems** in engineering, biology, or computer science.