\n
## Scatter Plot: Accuracy vs. Time-to-Answer
### Overview
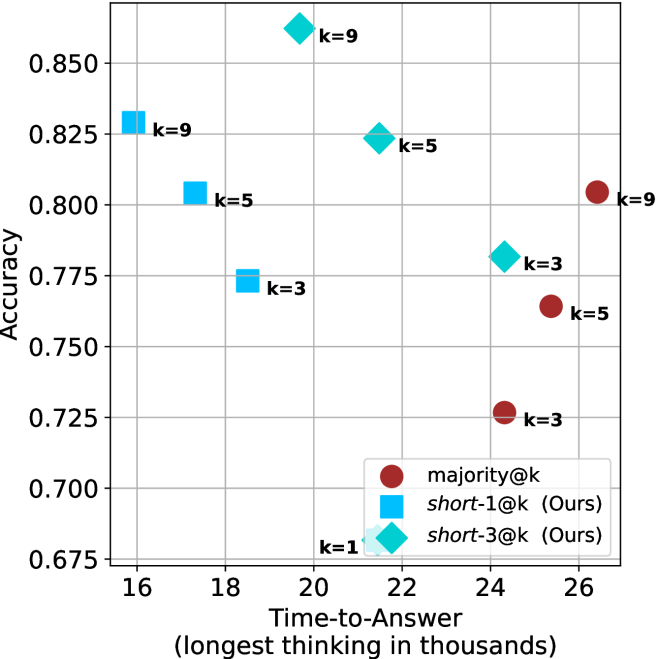
This image presents a scatter plot comparing the accuracy and time-to-answer for different values of 'k' across three methods: majority@k, short-1@k (labeled "Ours"), and short-3@k (labeled "Ours"). The x-axis represents "Time-to-Answer" in thousands of units, and the y-axis represents "Accuracy". Each data point is labeled with the corresponding 'k' value.
### Components/Axes
* **X-axis:** "Time-to-Answer (longest thinking in thousands)" - Scale ranges from approximately 16 to 26.
* **Y-axis:** "Accuracy" - Scale ranges from approximately 0.675 to 0.850.
* **Legend:** Located in the bottom-right corner.
* **majority@k:** Represented by red circles.
* **short-1@k (Ours):** Represented by light blue diamonds.
* **short-3@k (Ours):** Represented by dark blue squares.
* **Data Labels:** Each data point is labeled with the value of 'k' (k=1, k=3, k=5, k=9).
### Detailed Analysis
Let's analyze each data series individually:
**1. majority@k (Red Circles):**
* The trend is generally upward, with accuracy increasing as time-to-answer increases.
* k=3: Approximately (25.5, 0.725)
* k=5: Approximately (25, 0.75)
* k=9: Approximately (26, 0.80)
**2. short-1@k (Light Blue Diamonds):**
* The trend is also generally upward, but with a steeper slope than majority@k.
* k=1: Approximately (19.5, 0.68)
* k=3: Approximately (18, 0.77)
* k=5: Approximately (22, 0.825)
* k=9: Approximately (22.5, 0.85)
**3. short-3@k (Dark Blue Squares):**
* The trend is upward, but less pronounced than short-1@k.
* k=3: Approximately (18, 0.77)
* k=5: Approximately (22, 0.82)
* k=9: Approximately (22.5, 0.85)
### Key Observations
* For all values of 'k', the "short-1@k" method consistently achieves the highest accuracy.
* The "short-3@k" method generally performs similarly to "short-1@k", especially at higher values of 'k'.
* The "majority@k" method consistently has the lowest accuracy across all 'k' values.
* Increasing 'k' generally leads to higher accuracy for all methods, but the improvement is more significant for "short-1@k" and "short-3@k".
* The "short-1@k" and "short-3@k" methods achieve comparable accuracy at k=9.
### Interpretation
The data suggests that the "short-1@k" method is the most effective in balancing accuracy and time-to-answer. While increasing 'k' generally improves accuracy, the gains diminish, and the time-to-answer increases. The "majority@k" method appears to be less efficient, requiring significantly more time to achieve lower accuracy. The close performance of "short-1@k" and "short-3@k" at k=9 suggests that increasing the number of short answers considered beyond a certain point (in this case, potentially k=5) does not yield substantial improvements in accuracy. The "Ours" label indicates that "short-1@k" and "short-3@k" are methods developed by the authors of the study, and they outperform the baseline "majority@k" method. The plot demonstrates a trade-off between accuracy and computational cost (represented by time-to-answer), and the "short-1@k" method appears to offer the best compromise.