## Scatter Plot: Accuracy vs. Time-to-Answer for Different Methods
### Overview
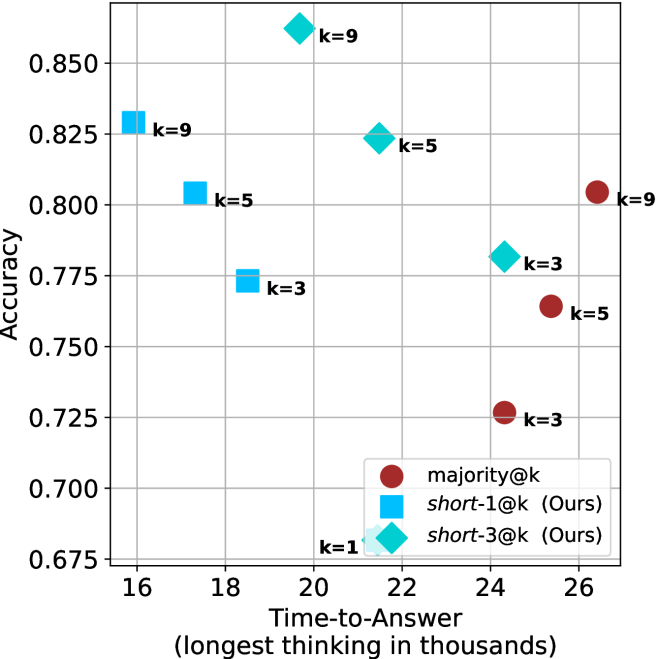
The image is a scatter plot comparing the performance of three different methods or models on a task. The plot visualizes the trade-off between **Accuracy** (y-axis) and **Time-to-Answer** (x-axis, measured in thousands of thinking steps). Each data point represents a specific configuration of a method, labeled with a parameter `k`. The chart suggests an analysis of efficiency versus effectiveness for different algorithmic approaches.
### Components/Axes
* **Chart Type:** Scatter plot with three distinct data series.
* **Y-Axis:** Labeled **"Accuracy"**. The scale runs from approximately 0.675 to 0.850, with major gridlines at intervals of 0.025 (0.675, 0.700, 0.725, etc.).
* **X-Axis:** Labeled **"Time-to-Answer (longest thinking in thousands)"**. The scale runs from 16 to 26, with major gridlines at intervals of 2 (16, 18, 20, etc.).
* **Legend:** Located in the **bottom-right quadrant** of the chart area. It defines three series:
1. **Red Circle:** `majority@k`
2. **Blue Square:** `short-1@k (Ours)`
3. **Cyan Diamond:** `short-3@k (Ours)`
* **Data Point Labels:** Each marker is annotated with text indicating its `k` value (e.g., `k=9`, `k=5`, `k=3`, `k=1`).
### Detailed Analysis
The plot contains nine distinct data points, three for each method.
**1. Series: `majority@k` (Red Circles)**
* **Trend:** Shows a **positive correlation**; as Time-to-Answer increases, Accuracy generally increases.
* **Data Points:**
* **Point 1:** `k=3`. Position: ~24.5 on x-axis, ~0.725 on y-axis.
* **Point 2:** `k=5`. Position: ~25.5 on x-axis, ~0.765 on y-axis.
* **Point 3:** `k=9`. Position: ~26.5 on x-axis, ~0.805 on y-axis.
**2. Series: `short-1@k (Ours)` (Blue Squares)**
* **Trend:** Shows a **negative correlation**; as Time-to-Answer increases, Accuracy decreases.
* **Data Points:**
* **Point 1:** `k=9`. Position: ~16.0 on x-axis, ~0.830 on y-axis.
* **Point 2:** `k=5`. Position: ~17.5 on x-axis, ~0.805 on y-axis.
* **Point 3:** `k=3`. Position: ~18.5 on x-axis, ~0.775 on y-axis.
**3. Series: `short-3@k (Ours)` (Cyan Diamonds)**
* **Trend:** Shows a **non-linear, peaked relationship**. Accuracy increases from `k=1` to a peak at `k=9`, while Time-to-Answer also increases.
* **Data Points:**
* **Point 1:** `k=1`. Position: ~21.5 on x-axis, ~0.675 on y-axis (lowest accuracy on the chart).
* **Point 2:** `k=3`. Position: ~24.5 on x-axis, ~0.780 on y-axis.
* **Point 3:** `k=5`. Position: ~22.0 on x-axis, ~0.825 on y-axis.
* **Point 4:** `k=9`. Position: ~20.0 on x-axis, ~0.860 on y-axis (highest accuracy on the chart).
### Key Observations
1. **Performance Frontier:** The `short-3@k` method (cyan diamonds) defines the upper-left performance frontier for higher `k` values (`k=5,9`), achieving the highest accuracies (~0.825, ~0.860) at moderate time costs (~22.0, ~20.0).
2. **Speed vs. Accuracy Trade-off:** The `short-1@k` method (blue squares) is the fastest (lowest Time-to-Answer, 16-18.5) but shows a clear trade-off: higher `k` yields higher accuracy but at the cost of increased time.
3. **Inefficiency of `majority@k`:** The `majority@k` method (red circles) is consistently the slowest (highest Time-to-Answer, 24.5-26.5) for its given accuracy levels. For example, at an accuracy of ~0.805, `majority@k` (`k=9`) requires ~26.5 time units, while `short-1@k` (`k=5`) requires only ~17.5.
4. **Parameter `k` Impact:** For the "Ours" methods, increasing `k` generally improves accuracy but has a complex effect on time. For `short-1@k`, higher `k` increases time. For `short-3@k`, the relationship is non-monotonic; the highest accuracy (`k=9`) occurs at a *lower* time (~20.0) than the `k=3` point (~24.5).
### Interpretation
This chart likely comes from a research paper evaluating novel methods (`short-1@k` and `short-3@k`, labeled "Ours") against a baseline (`majority@k`) for a reasoning or question-answering task where "thinking time" is a measurable resource.
* **The data suggests** that the proposed `short-3@k` method is the most effective, capable of reaching peak accuracy. Its non-linear trend implies an optimal operating point (around `k=5` or `k=9`) where it maximizes accuracy without a proportional increase in computational cost.
* **The `short-1@k` method** appears optimized for speed, offering a fast but less accurate solution. Its negative trend indicates that forcing it to consider more candidates (`k`) degrades its efficiency without a net accuracy gain in this time-accuracy view.
* **The `majority@k` baseline** is shown to be computationally expensive. The positive trend suggests it benefits from more "thinking" time, but it is outperformed in both speed and peak accuracy by the new methods.
* **The overarching narrative** is one of algorithmic improvement: the new methods (`short-*`) achieve better accuracy-time Pareto fronts than the baseline. `short-3@k` is the high-accuracy specialist, while `short-1@k` is the low-latency specialist. The choice between them would depend on whether the application prioritizes maximum correctness or minimal response time.