## Scatter Plot: Accuracy vs. Time-to-Answer for Different Strategies
### Overview
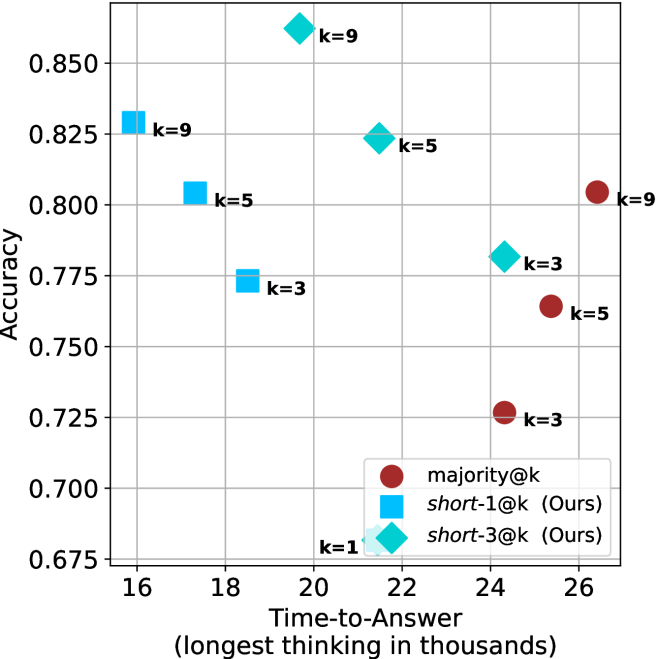
The image is a scatter plot comparing the accuracy of three strategies ("majority@k", "short-1@k", and "short-3@k") against their time-to-answer (measured in thousands of units). The plot uses distinct markers and colors to differentiate the strategies, with numerical labels for the "k" parameter embedded in the data points.
### Components/Axes
- **X-axis**: "Time-to-Answer (longest thinking in thousands)" ranging from 16 to 26.
- **Y-axis**: "Accuracy" ranging from 0.675 to 0.850.
- **Legend**: Located at the bottom-right corner, mapping:
- Red circles → "majority@k"
- Blue squares → "short-1@k (Ours)"
- Cyan diamonds → "short-3@k (Ours)"
- **Data Point Labels**: Each point is annotated with its "k" value (e.g., "k=3", "k=5", "k=9").
### Detailed Analysis
#### Data Series Trends
1. **majority@k (Red Circles)**:
- Points: (18, 0.75), (24, 0.725), (26, 0.80).
- Trend: Slightly increasing accuracy with longer time-to-answer, but lower overall accuracy compared to other strategies.
2. **short-1@k (Blue Squares)**:
- Points: (18, 0.775), (20, 0.825), (22, 0.85).
- Trend: Strong upward trend—higher accuracy correlates with longer time-to-answer.
3. **short-3@k (Cyan Diamonds)**:
- Points: (22, 0.825), (24, 0.775), (26, 0.725).
- Trend: Decreasing accuracy with longer time-to-answer, mirroring the inverse of "short-1@k".
#### Key Observations
- **Accuracy vs. Time Trade-off**:
- "short-1@k" achieves the highest accuracy (0.85) at a moderate time (22k), outperforming other strategies.
- "majority@k" has the lowest accuracy (0.725) at 24k but improves to 0.80 at 26k, suggesting diminishing returns.
- "short-3@k" shows a clear negative correlation between time and accuracy, with the highest accuracy (0.825) at 22k.
- **Outliers**:
- The "majority@k" point at (26, 0.80) is an outlier, as it achieves higher accuracy than its peers at the same time-to-answer range.
- **Legend Consistency**:
- All markers and colors align perfectly with the legend (e.g., red circles for "majority@k" are consistently placed).
### Interpretation
The data demonstrates that the "short-1@k" strategy optimizes both accuracy and efficiency, achieving the highest accuracy (0.85) at a reasonable time (22k). In contrast, "majority@k" sacrifices accuracy for longer processing times, while "short-3@k" exhibits a counterintuitive decline in performance as time increases. The "k" parameter likely represents model complexity or configuration, with higher "k" values (e.g., 9) associated with slower but more accurate outcomes in some cases. The plot highlights a critical design consideration: balancing computational resources (time) against performance (accuracy) for different algorithmic approaches.