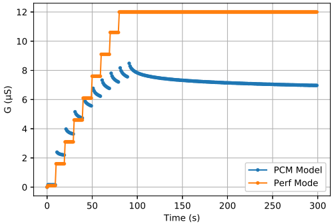
## Chart: PCM Model vs Perf Mode
### Overview
The image is a line chart comparing the performance of a "PCM Model" and "Perf Mode" over time. The chart displays the conductance (G) in microSiemens (µS) on the y-axis against time in seconds (s) on the x-axis. The PCM Model is represented by a blue line, and the Perf Mode is represented by an orange line.
### Components/Axes
* **X-axis:** Time (s), ranging from 0 to 300 seconds.
* **Y-axis:** G (µS), ranging from 0 to 12 microSiemens.
* **Legend:** Located in the bottom-right corner.
* Blue line: PCM Model
* Orange line: Perf Mode
### Detailed Analysis
* **PCM Model (Blue Line):**
* Initially, the conductance increases rapidly in a step-wise fashion, mirroring the Perf Mode.
* Around 80 seconds, the conductance peaks at approximately 8.5 µS.
* After the peak, the conductance decreases gradually, stabilizing around 7 µS after 200 seconds.
* **Perf Mode (Orange Line):**
* The conductance increases in discrete steps from 0 to approximately 12 µS between 0 and 80 seconds.
* After reaching 12 µS, the conductance remains constant for the rest of the time period.
### Key Observations
* The Perf Mode reaches its maximum conductance much faster than the PCM Model stabilizes.
* The PCM Model exhibits a peak and subsequent decay in conductance, while the Perf Mode maintains a constant conductance after reaching its maximum.
* The PCM Model's initial increase mirrors the Perf Mode's stepped increase.
### Interpretation
The chart compares the conductance of two different modes, PCM Model and Perf Mode, over time. The Perf Mode quickly reaches and maintains a high conductance, while the PCM Model shows a more dynamic behavior with an initial increase, a peak, and a subsequent decay to a stable value. This suggests that the Perf Mode provides a faster and more stable conductance, while the PCM Model may have a more complex underlying mechanism that leads to the observed peak and decay. The initial step-wise increase in both modes suggests a common underlying process or input that drives the initial conductance increase. The difference in behavior after the initial increase indicates different mechanisms or limitations in the two modes.