## Diagram: Batch Processing Grid
### Overview
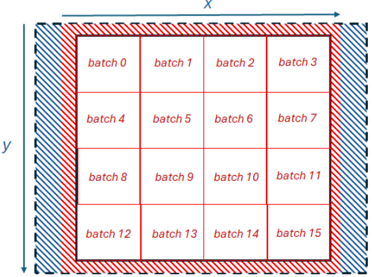
The image depicts a grid structure representing batch processing. The grid is divided into 16 equal cells, each labeled as a "batch" from 0 to 15. The grid is surrounded by a hatched border, with the inner region of the border being red and the outer region being blue. The x and y axes are indicated with arrows.
### Components/Axes
* **X-axis:** Horizontal axis, labeled "x" with a blue arrow pointing to the right.
* **Y-axis:** Vertical axis, labeled "y" with a blue arrow pointing downwards.
* **Grid:** A 4x4 grid dividing the space into 16 cells.
* **Batches:** Each cell is labeled with "batch" followed by a number from 0 to 15.
* **Border:** A hatched border surrounds the grid. The inner part of the border is red, and the outer part is blue.
### Detailed Analysis
The grid is structured as follows:
* **Row 1:** batch 0, batch 1, batch 2, batch 3
* **Row 2:** batch 4, batch 5, batch 6, batch 7
* **Row 3:** batch 8, batch 9, batch 10, batch 11
* **Row 4:** batch 12, batch 13, batch 14, batch 15
The batches are numbered sequentially from left to right and top to bottom.
### Key Observations
* The grid visually represents a division of data or tasks into 16 batches.
* The hatched border could indicate a boundary or a region of interest.
* The x and y axes suggest a spatial or coordinate system associated with the batches.
### Interpretation
The diagram illustrates a common concept in computer science and data processing where a large dataset or task is divided into smaller, manageable units called batches. This allows for parallel processing, efficient memory management, and easier debugging. The x and y axes could represent spatial coordinates, data indices, or any other relevant parameters. The border might indicate a region of focus or a boundary within which the batch processing occurs. The diagram is a high-level representation and does not provide specific details about the nature of the data or the processing being performed.