\n
## Diagram: Batch Division of a Rectangular Area
### Overview
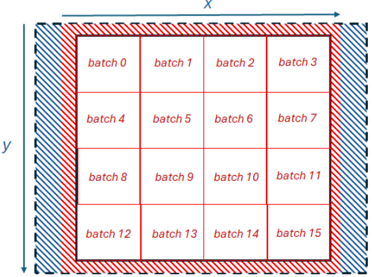
The image depicts a rectangular area divided into a 4x4 grid, representing 16 batches. The dimensions of the rectangle are labeled 'x' (horizontal) and 'y' (vertical). The outer border of the rectangle is highlighted with a red line and a diagonal hatch pattern. Each cell within the grid is labeled with a "batch" number, ranging from 0 to 15.
### Components/Axes
* **Rectangle:** Represents the total area.
* **x-axis:** Horizontal dimension, labeled 'x'.
* **y-axis:** Vertical dimension, labeled 'y'.
* **Grid:** 4x4 grid dividing the rectangle into 16 batches.
* **Batch Labels:** Each cell contains a label indicating the batch number (0-15).
* **Border:** A red line with a diagonal hatch pattern outlines the entire rectangle.
### Detailed Analysis or Content Details
The rectangular area is divided into 16 equal-sized batches arranged in four rows and four columns. The batches are numbered sequentially from left to right, top to bottom:
* **Row 1:** batch 0, batch 1, batch 2, batch 3
* **Row 2:** batch 4, batch 5, batch 6, batch 7
* **Row 3:** batch 8, batch 9, batch 10, batch 11
* **Row 4:** batch 12, batch 13, batch 14, batch 15
The border is a consistent red line approximately 2 pixels wide, with a diagonal hatch pattern filling the space between the line and the edge of the rectangle. The dimensions 'x' and 'y' are indicated by arrows pointing along the respective axes.
### Key Observations
The diagram illustrates a systematic division of a rectangular area into discrete batches. The numbering scheme is consistent and sequential. The border highlights the overall boundary of the area. There is no data or values associated with each batch beyond its identification number.
### Interpretation
This diagram likely represents a partitioning scheme for processing or analyzing a larger area. The batches could represent individual units of work, regions of an image, or segments of data. The consistent grid structure suggests a uniform approach to division. The 'x' and 'y' labels indicate that the area has defined dimensions, which could be relevant for calculations or spatial analysis. The diagram itself doesn't provide any information about *what* is being batched, only *how* it is being divided. It's a conceptual representation of a division strategy, rather than a presentation of data.