## Diagram: Grid Layout of Batches
### Overview
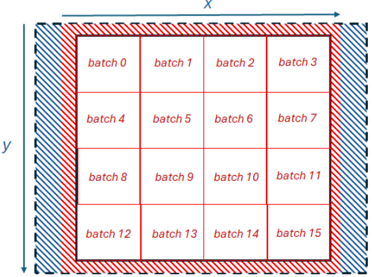
The image depicts a 4x4 grid of labeled "batch" cells (batch 0 to batch 15) enclosed within a larger dashed rectangular boundary. The grid is overlaid with red and blue diagonal striped patterns outside the dashed boundary, suggesting a distinct outer region. Axes labeled "X" (horizontal) and "Y" (vertical) define the coordinate system.
### Components/Axes
- **Grid Structure**:
- 4 rows (Y-axis) and 4 columns (X-axis).
- Each cell contains a sequentially numbered batch label (e.g., "batch 0" to "batch 15").
- **Axes**:
- **X-axis**: Labeled "X" with a rightward arrow, spanning the top edge of the grid.
- **Y-axis**: Labeled "Y" with a downward arrow, spanning the left edge of the grid.
- **Boundary**:
- Dashed black rectangle enclosing the grid.
- Outer region filled with alternating red and blue diagonal stripes.
### Detailed Analysis
- **Batch Labels**:
- Batches are arranged in row-major order:
- Row 1 (top): batch 0, batch 1, batch 2, batch 3
- Row 2: batch 4, batch 5, batch 6, batch 7
- Row 3: batch 8, batch 9, batch 10, batch 11
- Row 4 (bottom): batch 12, batch 13, batch 14, batch 15
- No numerical values or additional annotations within cells.
- **Boundary Stripes**:
- Red and blue diagonal stripes outside the dashed boundary suggest a secondary region, but no labels or data are present.
### Key Observations
1. **Sequential Labeling**: Batches are numbered consecutively from 0 to 15, following a left-to-right, top-to-bottom order.
2. **No Numerical Data**: The diagram lacks quantitative values, trends, or statistical indicators.
3. **Boundary Significance**: The striped outer region may represent a distinct operational zone (e.g., input/output, processing, or storage).
### Interpretation
This diagram likely represents a conceptual or architectural layout for organizing batches in a grid-based system. The sequential numbering implies a structured workflow or storage mechanism, where batches are processed or accessed in a fixed order. The striped outer region could denote a boundary for data transfer, error handling, or resource allocation. The absence of numerical data suggests the focus is on spatial organization rather than quantitative analysis. The grid’s simplicity indicates it may serve as a schematic for parallel processing, memory allocation, or task scheduling in computational systems.