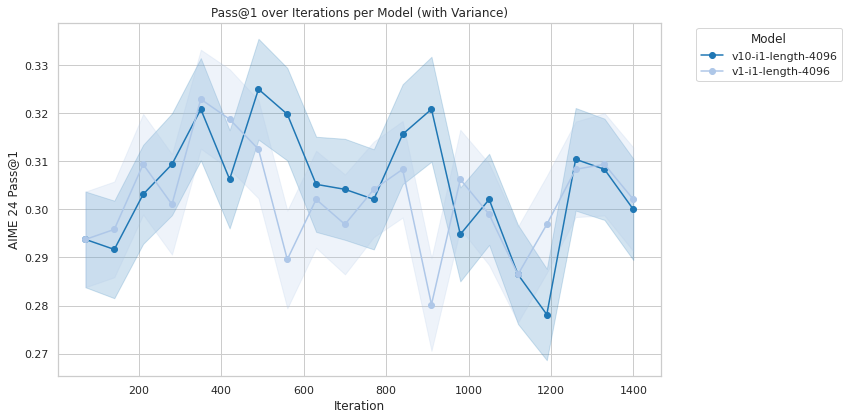
## Line Chart: Pass@1 over Iterations per Model (with Variance)
### Overview
The chart visualizes the performance of two models (`v10-i1-length-4096` and `v11-i1-length-4096`) across 1400 iterations, measured by the metric "AIME 24 Pass@1". The y-axis ranges from 0.27 to 0.33, while the x-axis spans iterations from 200 to 1400. The chart includes a legend, two data series (lines with shaded variance regions), and axis labels.
### Components/Axes
- **X-axis (Iteration)**: Labeled "Iteration" with ticks at 200, 400, 600, 800, 1000, 1200, and 1400.
- **Y-axis (AIME 24 Pass@1)**: Labeled "AIME 24 Pass@1" with ticks at 0.27, 0.28, 0.29, 0.30, 0.31, 0.32, and 0.33.
- **Legend**: Located in the top-right corner, with:
- **Blue line**: `v10-i1-length-4096` (solid line).
- **Light blue shaded area**: `v11-i1-length-4096` (mean ± variance).
### Detailed Analysis
- **Model `v10-i1-length-4096` (Blue Line)**:
- Starts at ~0.29 (iteration 200), fluctuates, and peaks at ~0.32 (iteration 400).
- Dips to ~0.28 (iteration 1000) before rising to ~0.31 (iteration 1200) and stabilizing near ~0.30 (iteration 1400).
- Variance (shaded blue region) is narrower compared to `v11`, indicating lower uncertainty.
- **Model `v11-i1-length-4096` (Light Blue Shaded Area)**:
- Starts at ~0.28 (iteration 200), peaks at ~0.31 (iteration 400), then fluctuates between ~0.28 and ~0.31.
- Variance (shaded light blue region) is wider, especially around iterations 400 and 1000, suggesting higher instability.
- Ends near ~0.30 (iteration 1400), with a slight downward trend after iteration 1000.
### Key Observations
1. **Performance Trends**:
- `v10` consistently achieves higher Pass@1 scores than `v11` across most iterations.
- Both models show volatility, but `v10` maintains a steadier trajectory.
2. **Variance**:
- `v11` exhibits significantly larger variance, particularly around iterations 400 and 1000, where the shaded region expands.
- `v10`’s narrower variance suggests more reliable performance.
3. **Outliers**:
- `v10`’s sharp dip to ~0.28 at iteration 1000 is an outlier compared to its otherwise stable trend.
- `v11`’s peak at iteration 400 (~0.31) is its highest point, followed by a decline.
### Interpretation
The data suggests that **model `v10-i1-length-4096` outperforms `v11-i1-length-4096` in terms of Pass@1 scores**, with greater stability (lower variance). The wider variance in `v11` indicates potential instability or sensitivity to hyperparameters or data distribution shifts. The dip in `v10` at iteration 1000 may reflect a temporary degradation, possibly due to overfitting or optimization challenges. Overall, `v10` appears more robust for applications requiring consistent performance, while `v11` might require further tuning to reduce variability.