## Line Chart: Pass@1 over Iterations per Model (with Variance)
### Overview
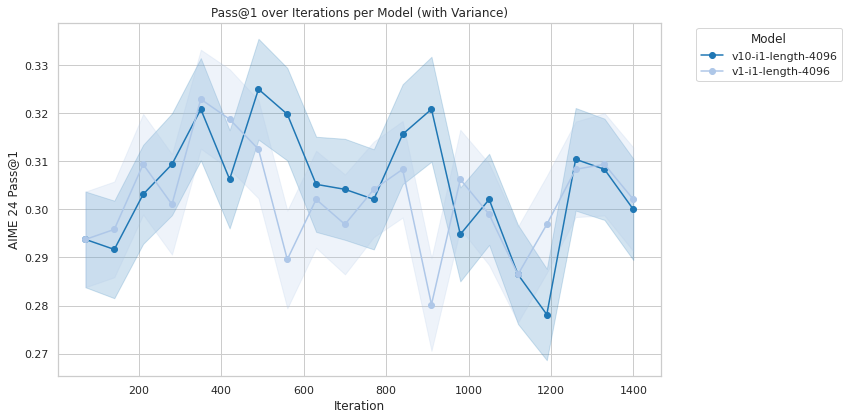
The image is a line chart comparing the performance of two models, "v10-il-length-4096" and "v1-il-length-4096", over iterations. The y-axis represents "AIME 24 Pass@1", a metric for model performance, and the x-axis represents "Iteration". The chart includes shaded regions around each line, indicating the variance in performance.
### Components/Axes
* **Title:** Pass@1 over Iterations per Model (with Variance)
* **X-axis:**
* Label: Iteration
* Scale: 200, 400, 600, 800, 1000, 1200, 1400
* **Y-axis:**
* Label: AIME 24 Pass@1
* Scale: 0.27, 0.28, 0.29, 0.30, 0.31, 0.32, 0.33
* **Legend (Top-Right):**
* Model
* Blue line with circle markers: v10-il-length-4096
* Light blue line with circle markers: v1-il-length-4096
### Detailed Analysis
* **v10-il-length-4096 (Dark Blue):**
* Trend: Generally fluctuates, with an overall slight upward trend until around iteration 900, then decreases slightly.
* Data Points (Approximate):
* Iteration 100: Pass@1 ~0.292
* Iteration 200: Pass@1 ~0.304
* Iteration 400: Pass@1 ~0.307
* Iteration 500: Pass@1 ~0.326
* Iteration 600: Pass@1 ~0.320
* Iteration 700: Pass@1 ~0.304
* Iteration 800: Pass@1 ~0.302
* Iteration 900: Pass@1 ~0.316
* Iteration 1000: Pass@1 ~0.321
* Iteration 1100: Pass@1 ~0.296
* Iteration 1200: Pass@1 ~0.278
* Iteration 1300: Pass@1 ~0.311
* Iteration 1400: Pass@1 ~0.308
* **v1-il-length-4096 (Light Blue):**
* Trend: Fluctuates more significantly than the dark blue line, with an overall relatively flat trend.
* Data Points (Approximate):
* Iteration 100: Pass@1 ~0.295
* Iteration 200: Pass@1 ~0.296
* Iteration 400: Pass@1 ~0.310
* Iteration 500: Pass@1 ~0.302
* Iteration 600: Pass@1 ~0.288
* Iteration 700: Pass@1 ~0.305
* Iteration 800: Pass@1 ~0.295
* Iteration 900: Pass@1 ~0.280
* Iteration 1000: Pass@1 ~0.307
* Iteration 1100: Pass@1 ~0.303
* Iteration 1200: Pass@1 ~0.312
* Iteration 1300: Pass@1 ~0.300
* Iteration 1400: Pass@1 ~0.299
### Key Observations
* The "v10-il-length-4096" model generally performs better than the "v1-il-length-4096" model, especially in the earlier iterations.
* Both models exhibit significant variance in performance across iterations, as indicated by the shaded regions.
* The performance of "v10-il-length-4096" peaks around iteration 500 and 1000.
* The performance of "v1-il-length-4096" peaks around iteration 400 and 1200.
### Interpretation
The chart compares the performance of two models over a series of iterations, taking into account the variance in their performance. The "v10-il-length-4096" model appears to be more stable and generally performs better than the "v1-il-length-4096" model. The variance in performance suggests that the models' performance is not consistent across all iterations, which could be due to factors such as the specific data used in each iteration or the stochastic nature of the training process. The trends suggest that further investigation into the factors affecting the models' performance is warranted.