## Line Chart: Pass@1 over Iterations per Model (with Variance)
### Overview
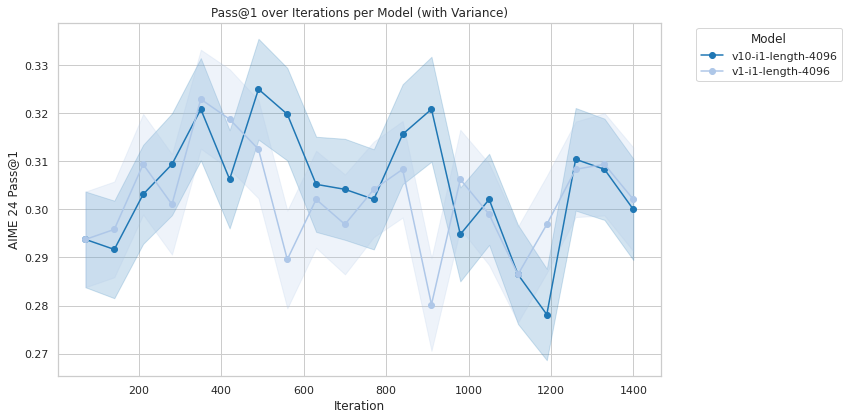
This line chart displays the performance of two models ("v10-i1-length-4096" and "v1-i1-length-4096") over iterations, measured by the "AIME 24 Pass@1" metric. The chart also shows the variance around each model's performance using shaded regions.
### Components/Axes
* **Title:** Pass@1 over Iterations per Model (with Variance) - positioned at the top-center.
* **X-axis:** "Iteration" - ranging from approximately 0 to 1400, with gridlines.
* **Y-axis:** "AIME 24 Pass@1" - ranging from approximately 0.27 to 0.33, with gridlines.
* **Legend:** Located in the top-right corner, labeling the two models:
* "v10-i1-length-4096" - represented by a dark blue line with circle markers.
* "v1-i1-length-4096" - represented by a light blue line with circle markers.
* **Shaded Regions:** Light blue shaded areas around each line represent the variance in performance.
### Detailed Analysis
**Model v10-i1-length-4096 (Dark Blue Line):**
The line initially slopes upward from iteration 0 to approximately iteration 200, increasing from roughly 0.28 to 0.31. It then fluctuates, peaking around iteration 400 at approximately 0.325, before decreasing to around 0.30 at iteration 600. From iteration 600 to 800, the line shows a slight upward trend, reaching approximately 0.32. It then declines to a low of around 0.28 at iteration 1000, followed by an increase to approximately 0.31 at iteration 1200, and finally stabilizes around 0.305 at iteration 1400.
* Iteration 0: ~0.28
* Iteration 200: ~0.31
* Iteration 400: ~0.325
* Iteration 600: ~0.30
* Iteration 800: ~0.32
* Iteration 1000: ~0.28
* Iteration 1200: ~0.31
* Iteration 1400: ~0.305
**Model v1-i1-length-4096 (Light Blue Line):**
This line starts at approximately 0.29 at iteration 0 and rises sharply to a peak of around 0.32 at iteration 400. It then experiences a significant drop to approximately 0.27 at iteration 1000. From iteration 1000, the line recovers somewhat, reaching approximately 0.29 at iteration 1400.
* Iteration 0: ~0.29
* Iteration 200: ~0.30
* Iteration 400: ~0.32
* Iteration 600: ~0.30
* Iteration 800: ~0.29
* Iteration 1000: ~0.27
* Iteration 1200: ~0.28
* Iteration 1400: ~0.29
The shaded regions around each line indicate the variance in performance. The variance appears to be larger during periods of rapid change in the lines.
### Key Observations
* Model "v10-i1-length-4096" generally exhibits more stable performance than "v1-i1-length-4096".
* Model "v1-i1-length-4096" shows a more dramatic drop in performance around iteration 1000.
* Both models show some degree of fluctuation in performance over the iterations.
* The variance around both models is significant, suggesting that the performance is not consistently predictable.
### Interpretation
The chart demonstrates the performance trends of two different models over a series of iterations, as measured by the AIME 24 Pass@1 metric. The variance bands suggest that the performance of each model is not deterministic and is subject to fluctuations.
The initial rise in performance for both models could indicate a learning phase where the models are adapting to the data. The subsequent fluctuations might be due to factors such as the specific data encountered during each iteration or the inherent stochasticity of the training process.
The significant drop in performance for "v1-i1-length-4096" around iteration 1000 is a notable outlier. This could be due to a variety of reasons, such as encountering a particularly challenging set of data, a change in the training parameters, or a bug in the model. Further investigation would be needed to determine the root cause of this drop.
The fact that both models eventually stabilize around similar performance levels (around 0.30-0.31) suggests that they may be converging towards a similar level of performance, or that they have reached a point of diminishing returns in terms of further improvement. The difference in variance suggests that "v10-i1-length-4096" is more robust.