\n
## Bar Chart: LLM Performance Comparison
### Overview
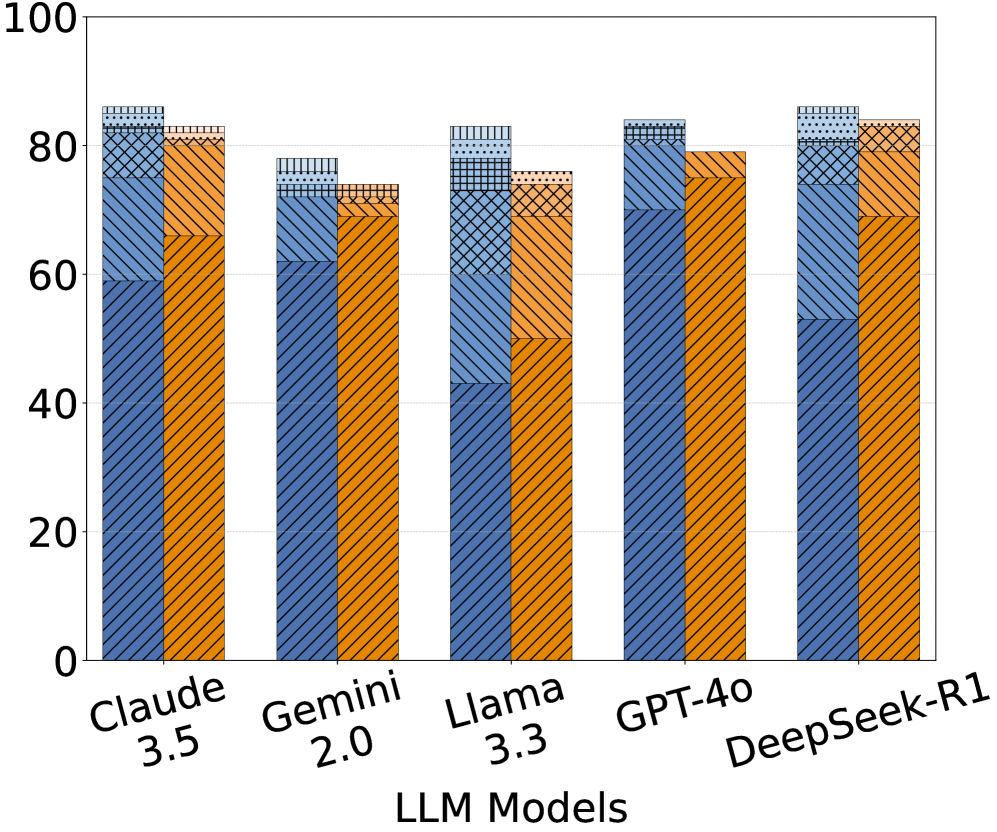
This is a grouped bar chart comparing the performance of five Large Language Models (LLMs) – Claude 3.5, Gemini 2.0, Llama 3.3, GPT-4.0, and DeepSeek-R1 – across three different metrics. The chart uses stacked bars to represent the contribution of each metric to the overall performance score.
### Components/Axes
* **X-axis:** LLM Models (Claude 3.5, Gemini 2.0, Llama 3.3, GPT-4.0, DeepSeek-R1)
* **Y-axis:** Scale ranging from 0 to 100 (representing performance score, units not specified).
* **Bar Groups:** Each LLM has a group of three bars, representing different metrics.
* **Legend:** (Inferred from bar colors)
* Blue: Metric 1 (unspecified)
* Orange: Metric 2 (unspecified)
* Hatched Pattern: Metric 3 (unspecified)
### Detailed Analysis
The chart presents performance data for each LLM, broken down into three components.
**Claude 3.5:**
* Metric 1 (Blue): Approximately 62.
* Metric 2 (Orange): Approximately 15.
* Metric 3 (Hatched): Approximately 23.
* Total: Approximately 100.
**Gemini 2.0:**
* Metric 1 (Blue): Approximately 72.
* Metric 2 (Orange): Approximately 15.
* Metric 3 (Hatched): Approximately 13.
* Total: Approximately 100.
**Llama 3.3:**
* Metric 1 (Blue): Approximately 65.
* Metric 2 (Orange): Approximately 15.
* Metric 3 (Hatched): Approximately 20.
* Total: Approximately 100.
**GPT-4.0:**
* Metric 1 (Blue): Approximately 82.
* Metric 2 (Orange): Approximately 15.
* Metric 3 (Hatched): Approximately 3.
* Total: Approximately 100.
**DeepSeek-R1:**
* Metric 1 (Blue): Approximately 75.
* Metric 2 (Orange): Approximately 15.
* Metric 3 (Hatched): Approximately 10.
* Total: Approximately 100.
### Key Observations
* GPT-4.0 consistently demonstrates the highest performance in Metric 1 (Blue), significantly outperforming other models.
* All models have a similar score for Metric 2 (Orange), around 15.
* The contribution of Metric 3 (Hatched) varies considerably between models.
* The total score for each model is approximately 100, suggesting the metrics are weighted to sum to this value.
### Interpretation
The chart suggests that GPT-4.0 excels in a particular performance aspect represented by Metric 1. The consistent performance of all models on Metric 2 indicates that this metric might represent a baseline capability or a common feature across these LLMs. The variation in Metric 3 suggests that this aspect is where the models differentiate themselves the most.
Without knowing what the metrics represent, it's difficult to draw definitive conclusions. However, the data implies that GPT-4.0 is the strongest performer overall, while the other models exhibit varying strengths and weaknesses in the third metric. The chart is useful for a comparative analysis of LLM performance, but requires further context to understand the specific capabilities being measured. The consistent value of Metric 2 across all models suggests it may be a fundamental capability or a standardized test component.