## Grouped Stacked Bar Chart: LLM Model Performance Comparison
### Overview
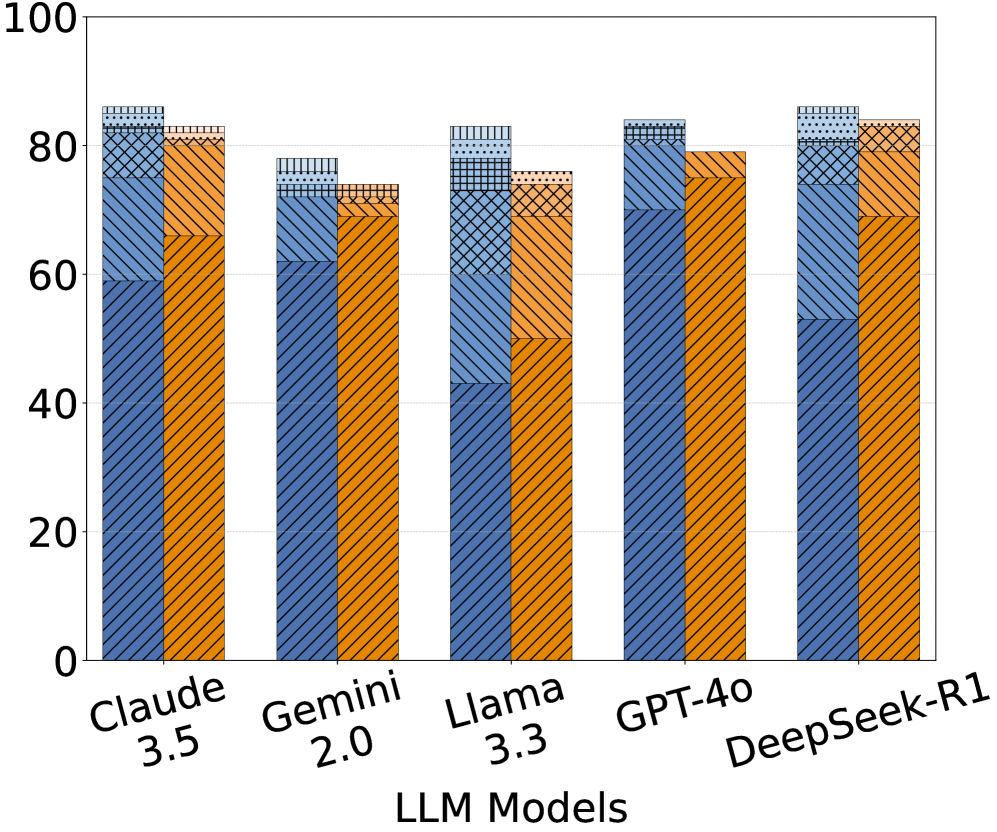
The image displays a grouped stacked bar chart comparing the performance of five Large Language Models (LLMs). Each model has two adjacent vertical bars: a blue bar on the left and an orange bar on the right. Each bar is composed of multiple stacked segments distinguished by different fill patterns (diagonal lines, cross-hatching, dots, etc.). The chart lacks a title, a legend, and specific axis titles beyond the model names and a numerical scale.
### Components/Axes
* **X-Axis (Horizontal):** Labeled "LLM Models". It lists five categorical items:
1. Claude 3.5
2. Gemini 2.0
3. Llama 3.3
4. GPT-4o
5. DeepSeek-R1
* **Y-Axis (Vertical):** A numerical scale ranging from 0 to 100, with major grid lines and labels at intervals of 20 (0, 20, 40, 60, 80, 100). The axis lacks a descriptive title (e.g., "Score," "Accuracy," "Percentage").
* **Data Series:** For each model, there are two data series represented by colored bars:
* **Blue Bar (Left):** Always positioned to the left within its model group.
* **Orange Bar (Right):** Always positioned to the right within its model group.
* **Bar Segments (Patterns):** Each bar is divided into 3-4 stacked segments. The patterns, from bottom to top within a bar, appear to be:
1. **Diagonal Lines (Bottom Segment):** Present in all bars.
2. **Cross-Hatch / Grid Pattern (Middle Segment):** Present in all bars.
3. **Dotted / Stippled Pattern (Upper Segment):** Present in most bars.
4. **A Different Cross-Hatch or Dense Pattern (Top Segment):** Present in some bars, often as the very top layer.
* **CRITICAL NOTE:** There is **no legend** provided in the image to define what these patterns represent (e.g., different tasks, metrics, or sub-categories). Therefore, their specific meaning cannot be determined from the image alone.
### Detailed Analysis
**Estimated Total Heights (Top of each bar):**
* **Claude 3.5:** Blue ≈ 86, Orange ≈ 83
* **Gemini 2.0:** Blue ≈ 78, Orange ≈ 74
* **Llama 3.3:** Blue ≈ 83, Orange ≈ 76
* **GPT-4o:** Blue ≈ 84, Orange ≈ 79
* **DeepSeek-R1:** Blue ≈ 86, Orange ≈ 84
**Estimated Segment Breakdown (Approximate values, bottom to top):**
* **Claude 3.5:**
* *Blue Bar:* Diagonal Lines ≈ 59, Cross-Hatch ≈ 16 (to 75), Dotted ≈ 11 (to 86).
* *Orange Bar:* Diagonal Lines ≈ 66, Cross-Hatch ≈ 15 (to 81), Top Pattern ≈ 2 (to 83).
* **Gemini 2.0:**
* *Blue Bar:* Diagonal Lines ≈ 62, Cross-Hatch ≈ 11 (to 73), Dotted ≈ 5 (to 78).
* *Orange Bar:* Diagonal Lines ≈ 70, Cross-Hatch ≈ 4 (to 74).
* **Llama 3.3:**
* *Blue Bar:* Diagonal Lines ≈ 43, Cross-Hatch ≈ 30 (to 73), Dotted ≈ 10 (to 83).
* *Orange Bar:* Diagonal Lines ≈ 50, Cross-Hatch ≈ 21 (to 71), Top Pattern ≈ 5 (to 76).
* **GPT-4o:**
* *Blue Bar:* Diagonal Lines ≈ 70, Cross-Hatch ≈ 11 (to 81), Dotted ≈ 3 (to 84).
* *Orange Bar:* Diagonal Lines ≈ 75, Cross-Hatch ≈ 4 (to 79).
* **DeepSeek-R1:**
* *Blue Bar:* Diagonal Lines ≈ 53, Cross-Hatch ≈ 27 (to 80), Dotted ≈ 6 (to 86).
* *Orange Bar:* Diagonal Lines ≈ 69, Cross-Hatch ≈ 15 (to 84).
### Key Observations
1. **Performance Range:** All models show total scores (combined segment heights) in the upper range, between approximately 74 and 86.
2. **Model Comparison:** DeepSeek-R1 and Claude 3.5 have the highest total scores for their blue bars (≈86). Gemini 2.0 has the lowest totals for both its blue and orange bars.
3. **Blue vs. Orange:** For every model, the blue bar's total height is greater than or equal to the orange bar's total height. The difference is most pronounced for Llama 3.3 (≈7 point difference) and smallest for DeepSeek-R1 (≈2 point difference).
4. **Segment Composition:** The "Diagonal Lines" segment is consistently the largest component of every bar. The "Cross-Hatch" segment varies significantly in size, being particularly large in the blue bars of Llama 3.3 and DeepSeek-R1.
5. **Missing Information:** The most critical observation is the **absence of a legend**. Without it, the chart is interpretable only in terms of relative heights and patterns, not in terms of what is being measured.
### Interpretation
This chart is designed to compare the performance of five major LLMs across two primary, unnamed categories (blue vs. orange), each of which is further broken down into sub-components (the patterned segments).
* **What the Data Suggests:** The data suggests that while all models perform at a high level, there are nuanced differences. DeepSeek-R1 and Claude 3.5 appear to be the top performers overall. The consistent pattern where the blue bar outperforms the orange bar for each model could indicate that the blue category represents a more fundamental or easier task, while the orange category might be a more challenging or specialized evaluation.
* **Relationship Between Elements:** The grouping by model allows for direct comparison of the two main categories (blue/orange) for each LLM. The stacking within bars shows the contribution of different sub-components to the total score in each category.
* **Notable Anomalies:** The most significant anomaly is the **lack of a legend**, which renders the chart's specific meaning ambiguous. A secondary anomaly is the varying size of the "Cross-Hatch" segment, which suggests that performance on the sub-task it represents is a key differentiator between models, especially for Llama 3.3 and DeepSeek-R1 in the blue category.
* **Peircean Investigation:** From a semiotic perspective, the chart uses **icons** (the bars) to represent model performance, **indices** (the height) to show magnitude, and **symbols** (the patterns) to denote categories. However, the symbolic meaning is broken due to the missing legend, leaving the viewer to rely solely on iconic and indexical information. The chart successfully conveys *that* there are differences but fails to communicate *what* those differences are in concrete terms. To be fully informative, it requires the accompanying legend defining the metrics for "Blue," "Orange," and each fill pattern.