## Chart: Accuracy vs. Question Number by Subject Type and Experiment Condition
### Overview
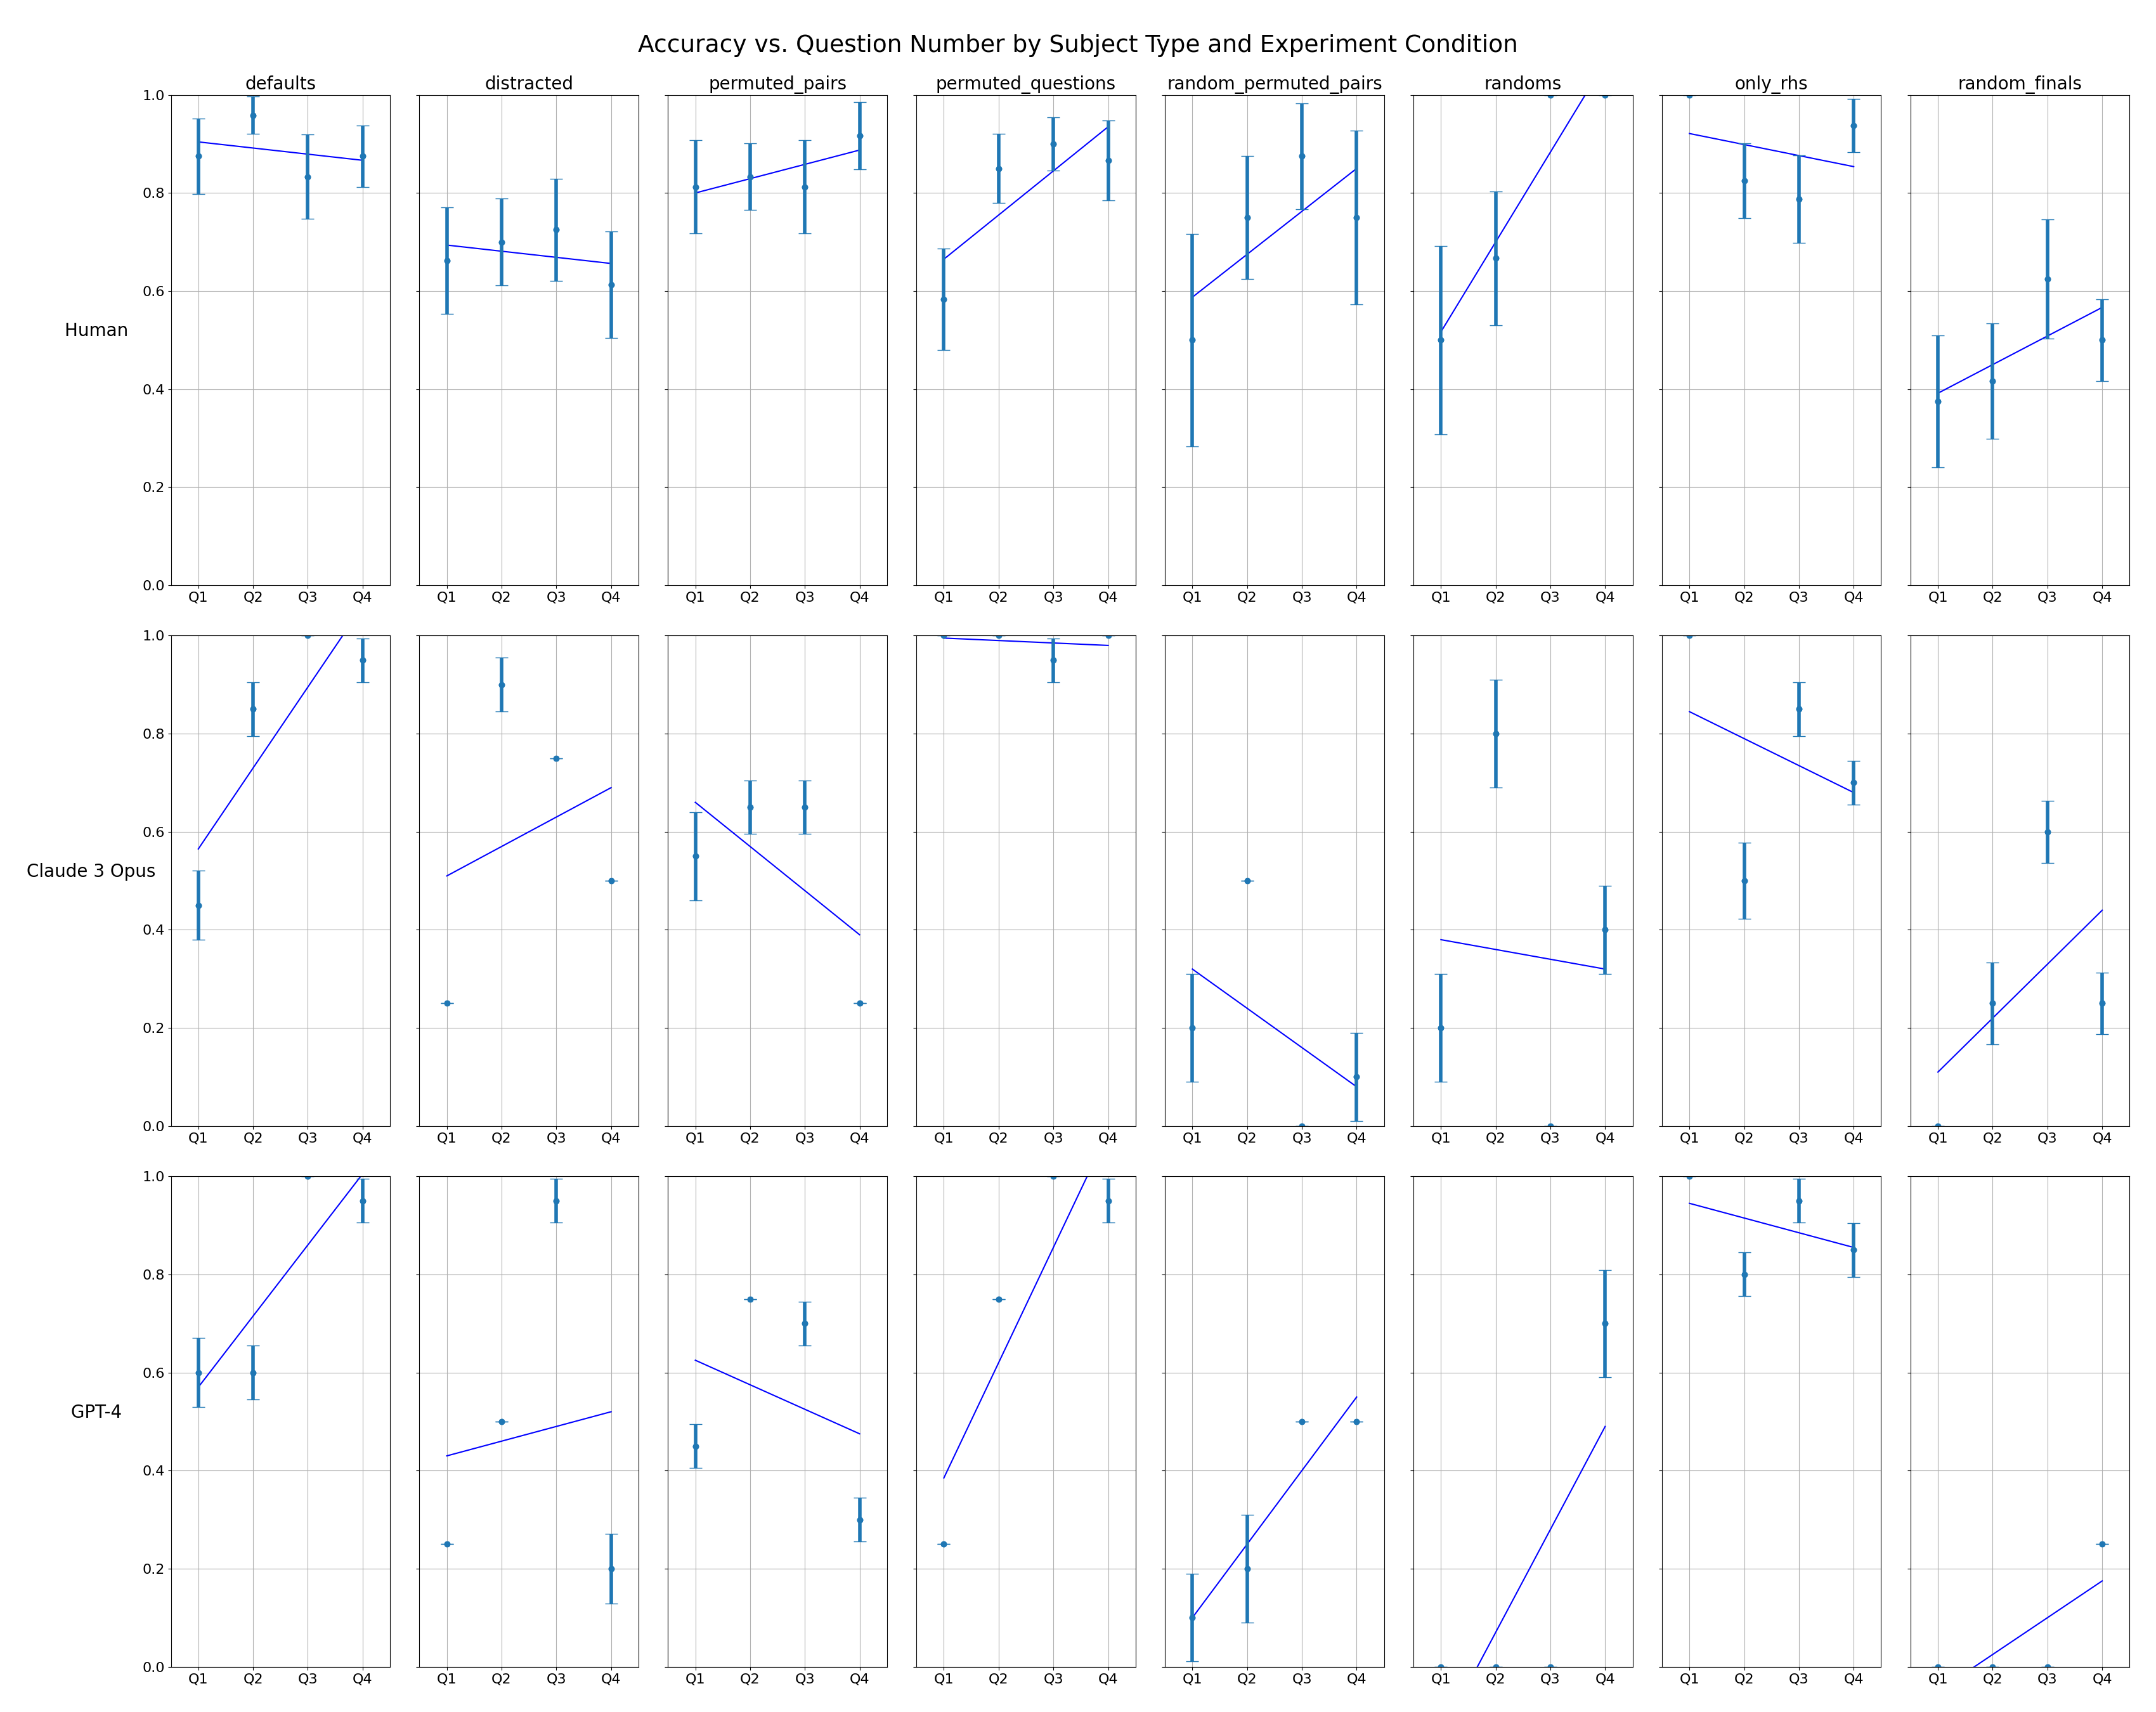
The image presents a series of line plots arranged in a 3x8 grid. Each plot visualizes the accuracy of different subjects (Human, Claude 3 Opus, GPT-4) across four question quartiles (Q1, Q2, Q3, Q4) under various experimental conditions (defaults, distracted, permuted_pairs, permuted_questions, random_permuted_pairs, randoms, only_rhs, random_finals). The plots include error bars indicating variability in the data.
### Components/Axes
* **Title:** Accuracy vs. Question Number by Subject Type and Experiment Condition
* **Y-axis:** Accuracy, ranging from 0.0 to 1.0
* **X-axis:** Question Quartiles (Q1, Q2, Q3, Q4)
* **Subjects (Rows):** Human, Claude 3 Opus, GPT-4
* **Experiment Conditions (Columns):** defaults, distracted, permuted\_pairs, permuted\_questions, random\_permuted\_pairs, randoms, only\_rhs, random\_finals
* **Data Points:** Teal dots representing accuracy for each quartile.
* **Error Bars:** Teal vertical lines extending above and below each data point, indicating the range of variability.
* **Trend Lines:** Blue lines indicating the general trend of accuracy across the quartiles.
### Detailed Analysis
**Row 1: Human**
* **defaults:** Accuracy starts around 0.95 in Q1 and slightly decreases to approximately 0.9 in Q4.
* **distracted:** Accuracy is around 0.7 in Q1 and decreases slightly to about 0.65 in Q4.
* **permuted\_pairs:** Accuracy is relatively stable, staying around 0.85-0.9 across all quartiles.
* **permuted\_questions:** Accuracy increases from approximately 0.75 in Q1 to 0.9 in Q4.
* **random\_permuted\_pairs:** Accuracy increases from approximately 0.65 in Q1 to 0.85 in Q4.
* **randoms:** Accuracy increases sharply from approximately 0.5 in Q1 to nearly 1.0 in Q4.
* **only\_rhs:** Accuracy is relatively stable, staying around 0.9 across all quartiles.
* **random\_finals:** Accuracy increases from approximately 0.3 in Q1 to 0.6 in Q4.
**Row 2: Claude 3 Opus**
* **defaults:** Accuracy increases from approximately 0.6 in Q1 to nearly 1.0 in Q4.
* **distracted:** Accuracy starts around 0.25 in Q1, increases to approximately 0.75 in Q3, and decreases to 0.5 in Q4.
* **permuted\_pairs:** Accuracy is relatively stable, staying around 0.6 across all quartiles.
* **permuted\_questions:** Accuracy decreases from approximately 0.25 in Q1 to 0.1 in Q4.
* **random\_permuted\_pairs:** Accuracy decreases from approximately 0.9 in Q1 to 0.2 in Q4.
* **randoms:** Accuracy is relatively stable, staying around 0.8 across all quartiles.
* **only\_rhs:** Accuracy decreases from approximately 0.8 in Q1 to 0.6 in Q4.
* **random\_finals:** Accuracy increases from approximately 0.1 in Q1 to 0.4 in Q4.
**Row 3: GPT-4**
* **defaults:** Accuracy increases from approximately 0.6 in Q1 to nearly 1.0 in Q4.
* **distracted:** Accuracy starts around 0.25 in Q1 and increases slightly to about 0.5 in Q4.
* **permuted\_pairs:** Accuracy decreases from approximately 0.7 in Q1 to 0.5 in Q4.
* **permuted\_questions:** Accuracy increases from approximately 0.1 in Q1 to 0.5 in Q4.
* **random\_permuted\_pairs:** Accuracy increases from approximately 0.0 in Q1 to 0.9 in Q4.
* **randoms:** Accuracy is relatively stable, staying around 0.9 across all quartiles.
* **only\_rhs:** Accuracy decreases from approximately 0.9 in Q1 to 0.8 in Q4.
* **random\_finals:** Accuracy increases from approximately 0.0 in Q1 to 0.2 in Q4.
### Key Observations
* **Human Performance:** Generally high accuracy across most conditions, with some decrease in accuracy under "distracted" conditions. "randoms" condition shows a significant increase in accuracy across quartiles.
* **Claude 3 Opus Performance:** More variable performance across conditions. "defaults" shows a significant increase in accuracy across quartiles. "random\_permuted\_pairs" shows a significant decrease in accuracy across quartiles.
* **GPT-4 Performance:** Similar to Claude 3 Opus, GPT-4 shows variable performance. "defaults" and "random\_permuted\_pairs" show significant increases in accuracy across quartiles.
### Interpretation
The data suggests that different subjects (Human, Claude 3 Opus, GPT-4) respond differently to various experimental conditions related to question types and permutations. Humans generally maintain high accuracy, while the AI models (Claude 3 Opus and GPT-4) exhibit more variability, indicating sensitivity to the specific question types and experimental setups. The "randoms" condition appears to be particularly challenging for the AI models in some cases, while the "defaults" condition seems to improve their accuracy over time (across quartiles). The error bars indicate the variability within each condition, suggesting that some conditions lead to more consistent performance than others. The trends observed in the plots can be used to understand the strengths and weaknesses of each subject under different cognitive loads and question formats.