## Line Chart Grid: Accuracy vs. Question Number by Subject Type and Experiment Condition
### Overview
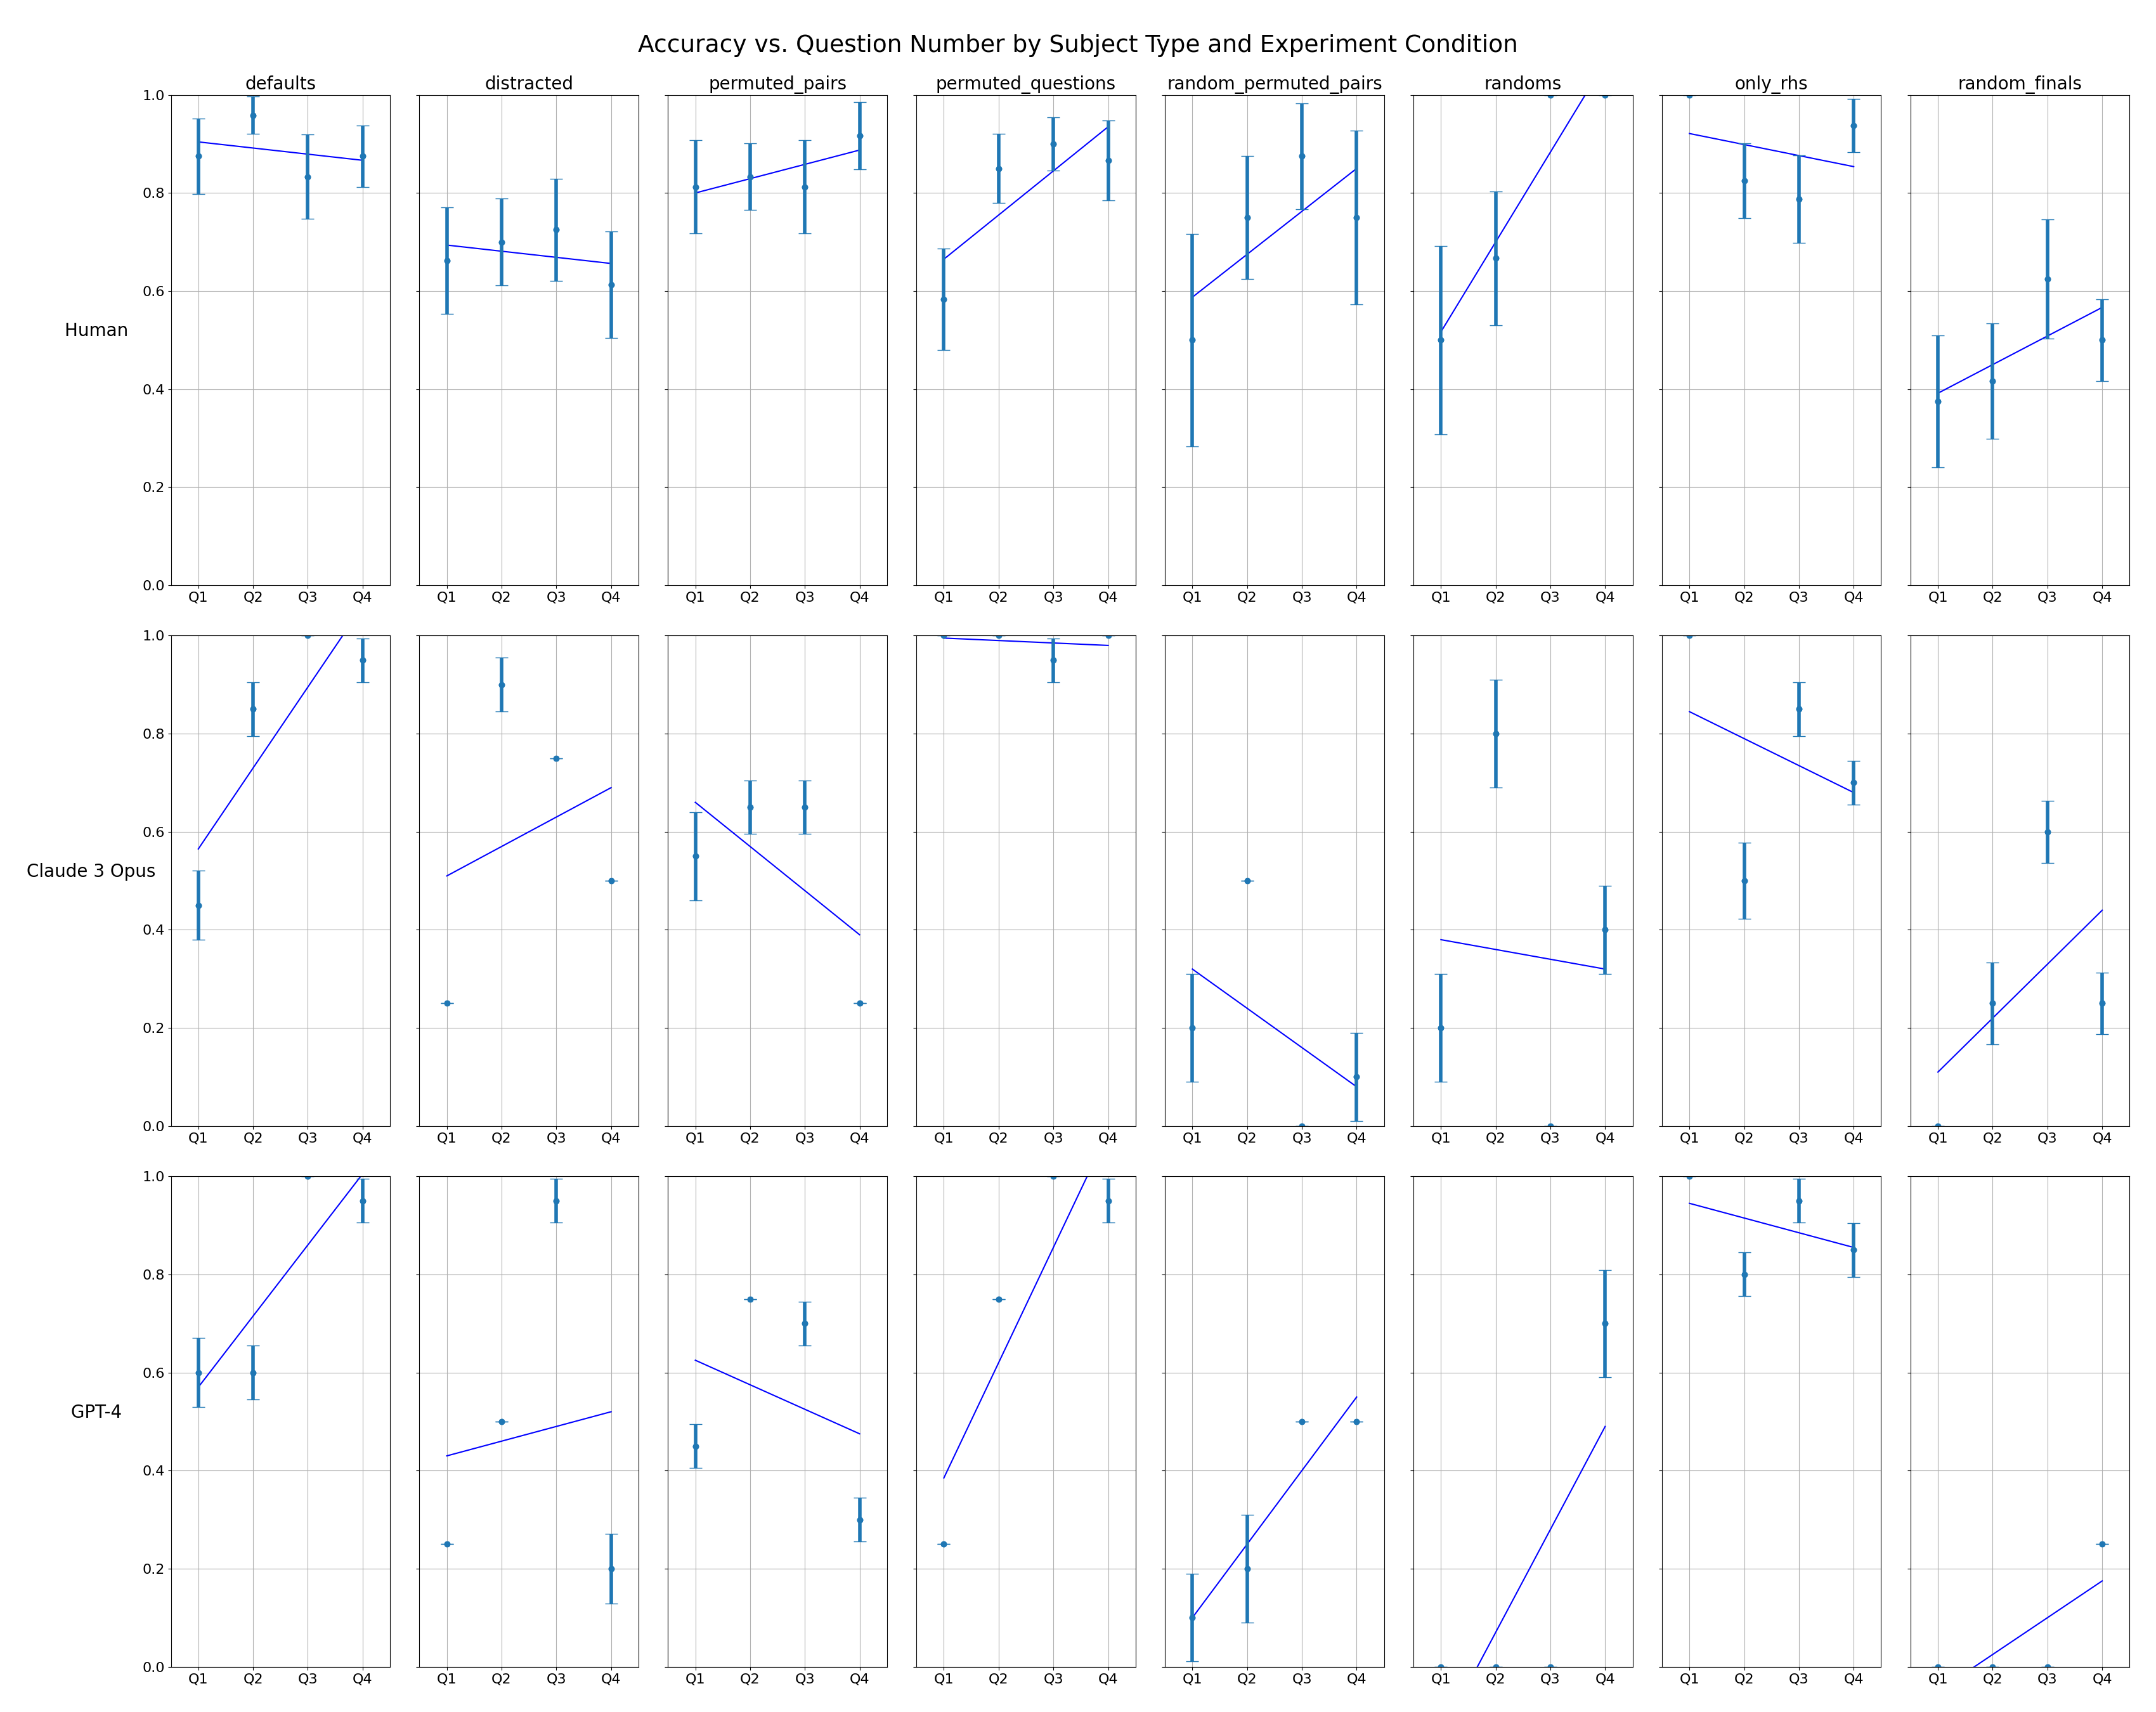
The image displays a 3x8 grid of line charts comparing accuracy trends across four question sets (Q1-Q4) for three subject types (Human, Claude 3 Opus, GPT-4) under eight experimental conditions. Each chart includes error bars representing measurement uncertainty. The legend in the top-left corner maps colors to subject types: blue (Human), green (Claude 3 Opus), and purple (GPT-4).
### Components/Axes
- **X-axis**: Question Number (Q1, Q2, Q3, Q4)
- **Y-axis**: Accuracy (0.0 to 1.0 scale)
- **Legend**:
- Blue: Human
- Green: Claude 3 Opus
- Purple: GPT-4
- **Experiment Conditions** (column labels):
1. defaults
2. distracted
3. permuted_pairs
4. permuted_questions
5. random_permuted_pairs
6. randoms
7. only_rhs
8. random_finals
### Detailed Analysis
#### Human Row
1. **defaults**: Starts at ~0.9 (Q1) with gradual decline to ~0.85 (Q4). Error bars range ±0.05.
2. **distracted**: Peaks at ~0.75 (Q1), drops to ~0.65 (Q4). Error bars ±0.1.
3. **permuted_pairs**: Rises from ~0.7 (Q1) to ~0.9 (Q4). Error bars ±0.07.
4. **permuted_questions**: Sharp increase from ~0.6 (Q1) to ~0.95 (Q4). Error bars ±0.08.
5. **random_permuted_pairs**: Starts at ~0.5 (Q1), peaks at ~0.8 (Q3), drops to ~0.7 (Q4). Error bars ±0.12.
6. **randoms**: Gradual rise from ~0.6 (Q1) to ~0.9 (Q4). Error bars ±0.09.
7. **only_rhs**: Declines from ~0.9 (Q1) to ~0.8 (Q4). Error bars ±0.06.
8. **random_finals**: Starts at ~0.5 (Q1), rises to ~0.7 (Q4). Error bars ±0.1.
#### Claude 3 Opus Row
1. **defaults**: Flat line at ~0.95 across all Qs. Error bars ±0.03.
2. **distracted**: Drops to ~0.8 (Q1), stabilizes at ~0.75 (Q4). Error bars ±0.05.
3. **permuted_pairs**: Declines from ~0.9 (Q1) to ~0.6 (Q4). Error bars ±0.1.
4. **permuted_questions**: Flat at ~0.95 (Q1-Q3), drops to ~0.8 (Q4). Error bars ±0.04.
5. **random_permuted_pairs**: Flat at ~0.7 (Q1-Q2), drops to ~0.5 (Q4). Error bars ±0.15.
6. **randoms**: Flat at ~0.85 (Q1-Q3), drops to ~0.7 (Q4). Error bars ±0.06.
7. **only_rhs**: Declines from ~0.95 (Q1) to ~0.85 (Q4). Error bars ±0.05.
8. **random_finals**: Flat at ~0.6 (Q1-Q3), rises to ~0.7 (Q4). Error bars ±0.1.
#### GPT-4 Row
1. **defaults**: Flat at ~0.98 across all Qs. Error bars ±0.02.
2. **distracted**: Drops to ~0.9 (Q1), stabilizes at ~0.85 (Q4). Error bars ±0.03.
3. **permuted_pairs**: Rises from ~0.8 (Q1) to ~0.95 (Q4). Error bars ±0.05.
4. **permuted_questions**: Flat at ~0.98 (Q1-Q3), drops to ~0.9 (Q4). Error bars ±0.02.
5. **random_permuted_pairs**: Flat at ~0.9 (Q1-Q2), drops to ~0.7 (Q4). Error bars ±0.04.
6. **randoms**: Flat at ~0.95 (Q1-Q3), drops to ~0.8 (Q4). Error bars ±0.03.
7. **only_rhs**: Declines from ~0.98 (Q1) to ~0.9 (Q4). Error bars ±0.02.
8. **random_finals**: Flat at ~0.7 (Q1-Q3), rises to ~0.8 (Q4). Error bars ±0.05.
### Key Observations
1. **Human Performance**:
- Struggles most in "distracted" and "random_permuted_pairs" conditions.
- Shows improvement in "permuted_questions" and "randoms" conditions.
- Highest variability in "random_permuted_pairs" (±0.12 error bars).
2. **Claude 3 Opus**:
- Maintains high accuracy in "defaults" and "permuted_questions" but declines sharply in "permuted_pairs" and "random_permuted_pairs".
- "random_finals" shows late improvement despite low initial performance.
3. **GPT-4**:
- Consistently high accuracy across all conditions, with minimal drops in "only_rhs" and "randoms".
- "random_finals" demonstrates late-stage improvement, suggesting adaptive learning.
### Interpretation
The data reveals distinct performance patterns between human and AI subjects:
- **Humans** exhibit context-dependent variability, with accuracy heavily influenced by task structure (e.g., permutations reduce performance).
- **Claude 3 Opus** shows robustness in structured tasks but falters in randomized conditions, suggesting limited generalization.
- **GPT-4** maintains near-perfect accuracy across most conditions, with only minor declines in randomized tasks, indicating superior adaptability.
Notably, the "random_finals" condition shows late improvement for all subjects, potentially reflecting task familiarity or algorithmic adjustments. Error bars highlight that human measurements are less reliable (±0.1 vs. ±0.02 for GPT-4), emphasizing the need for larger sample sizes in human studies.