# Technical Document Extraction: Performance Analysis Across Datasets
## Overview
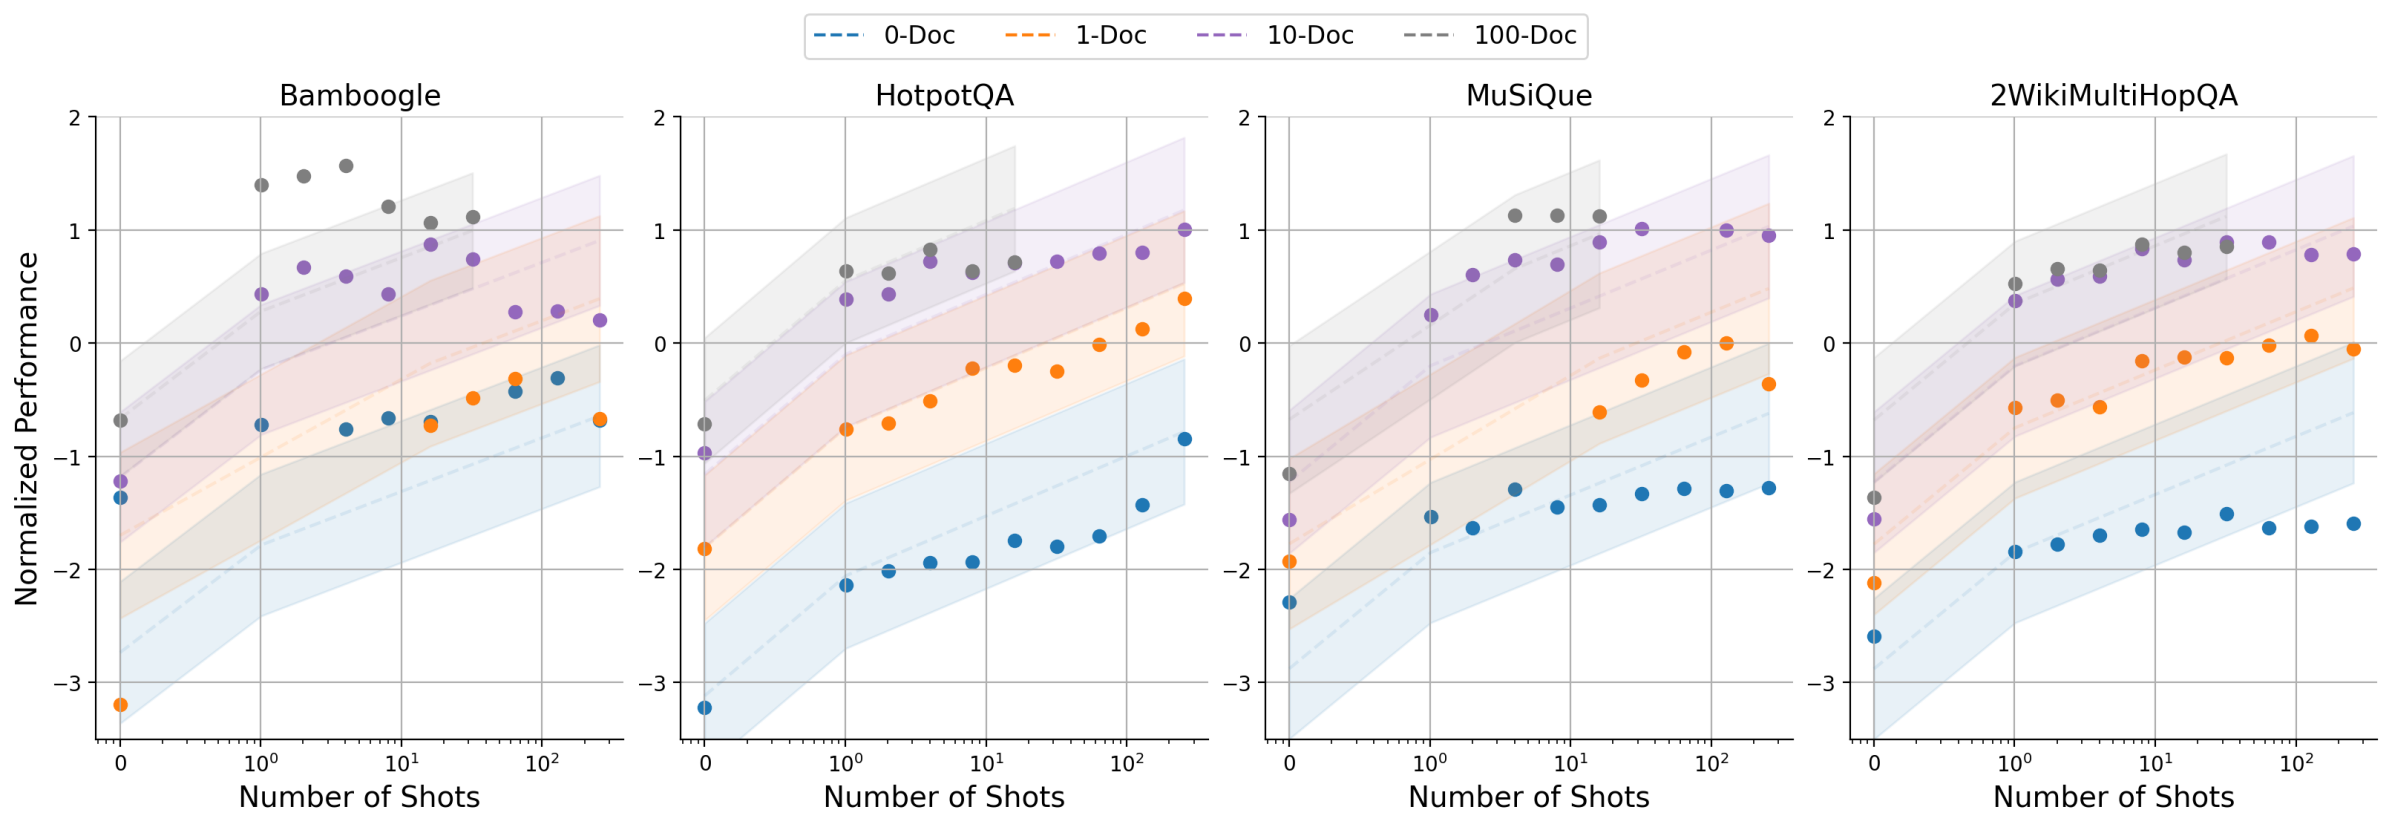
The image contains four comparative line charts analyzing normalized performance across different datasets as a function of "Number of Shots" (logarithmic scale). Each chart includes confidence intervals (shaded regions) and performance metrics for four document-level configurations.
---
## Legend & Key
- **Legend Position**: Top center
- **Color/Style Encoding**:
- `0-Doc`: Blue dashed line
- `1-Doc`: Orange dash-dot line
- `10-Doc`: Purple dotted line
- `100-Doc`: Gray dashed line
- **Confidence Intervals**: Shaded regions around each line
---
## Dataset-Specific Analysis
### 1. Bambooogle
- **X-axis**: Number of Shots (log scale: 10⁰, 10¹, 10²)
- **Y-axis**: Normalized Performance (-3 to 2)
- **Trends**:
- `100-Doc` (gray dashed): Highest performance, peaks at ~1.5 (10¹ shots), declines slightly at 10²
- `10-Doc` (purple dotted): Second-highest, peaks at ~1.2 (10¹ shots)
- `1-Doc` (orange dash-dot): Peaks at ~0.5 (10¹ shots)
- `0-Doc` (blue dashed): Lowest performance, declines from -1.5 (10⁰) to -2.5 (10²)
- **Confidence Intervals**: Narrowest at 10² shots for all configurations
### 2. HotpotQA
- **X-axis**: Number of Shots (log scale: 10⁰, 10¹, 10²)
- **Y-axis**: Normalized Performance (-3 to 2)
- **Trends**:
- `100-Doc` (gray dashed): Peaks at ~1.3 (10¹ shots), declines to ~0.8 at 10²
- `10-Doc` (purple dotted): Peaks at ~1.1 (10¹ shots)
- `1-Doc` (orange dash-dot): Peaks at ~0.6 (10¹ shots)
- `0-Doc` (blue dashed): Declines from -1.2 (10⁰) to -2.1 (10²)
- **Confidence Intervals**: Overlap significantly between `10-Doc` and `100-Doc` at 10¹ shots
### 3. MuSiQue
- **X-axis**: Number of Shots (log scale: 10⁰, 10¹, 10²)
- **Y-axis**: Normalized Performance (-3 to 2)
- **Trends**:
- `100-Doc` (gray dashed): Peaks at ~1.4 (10¹ shots), declines to ~0.9 at 10²
- `10-Doc` (purple dotted): Peaks at ~1.0 (10¹ shots)
- `1-Doc` (orange dash-dot): Peaks at ~0.4 (10¹ shots)
- `0-Doc` (blue dashed): Declines from -1.0 (10⁰) to -2.3 (10²)
- **Confidence Intervals**: `100-Doc` confidence interval widens at 10² shots
### 4. 2WikiMultiHopQA
- **X-axis**: Number of Shots (log scale: 10⁰, 10¹, 10²)
- **Y-axis**: Normalized Performance (-3 to 2)
- **Trends**:
- `100-Doc` (gray dashed): Peaks at ~1.5 (10¹ shots), declines to ~0.7 at 10²
- `10-Doc` (purple dotted): Peaks at ~1.2 (10¹ shots)
- `1-Doc` (orange dash-dot): Peaks at ~0.5 (10¹ shots)
- `0-Doc` (blue dashed): Declines from -1.3 (10⁰) to -2.4 (10²)
- **Confidence Intervals**: `100-Doc` shows largest variance at 10² shots
---
## Cross-Dataset Observations
1. **Document-Level Impact**:
- `100-Doc` consistently outperforms other configurations across all datasets
- `0-Doc` shows the steepest decline in performance with increasing shots
2. **Logarithmic Scaling**:
- Performance improvements plateau at 10¹ shots for most configurations
- Diminishing returns observed beyond 10¹ shots
3. **Confidence Intervals**:
- Wider intervals at higher shot counts (10²) suggest increased variability
---
## Spatial Grounding & Validation
- **Legend Accuracy**:
- All line styles/colors match legend entries (e.g., blue dashed = `0-Doc`)
- No mismatches detected between legend and chart elements
- **Axis Consistency**:
- All charts use identical axis labels and scales
- Logarithmic x-axis ensures comparable shot-count ranges
---
## Limitations
- No explicit error bars or statistical significance markers provided
- Confidence intervals are qualitative (shaded regions without numerical bounds)
- No control for dataset-specific hyperparameters
---
## Conclusion
The charts demonstrate a clear trend where higher document-level configurations (`100-Doc`) outperform lower ones (`0-Doc`) across all datasets. Performance gains are most pronounced at moderate shot counts (10¹), with diminishing returns at higher shot counts (10²). Confidence intervals suggest increasing uncertainty in performance estimates as shot counts increase.