## Line Graph: Accuracy vs. Sample Size (k)
### Overview
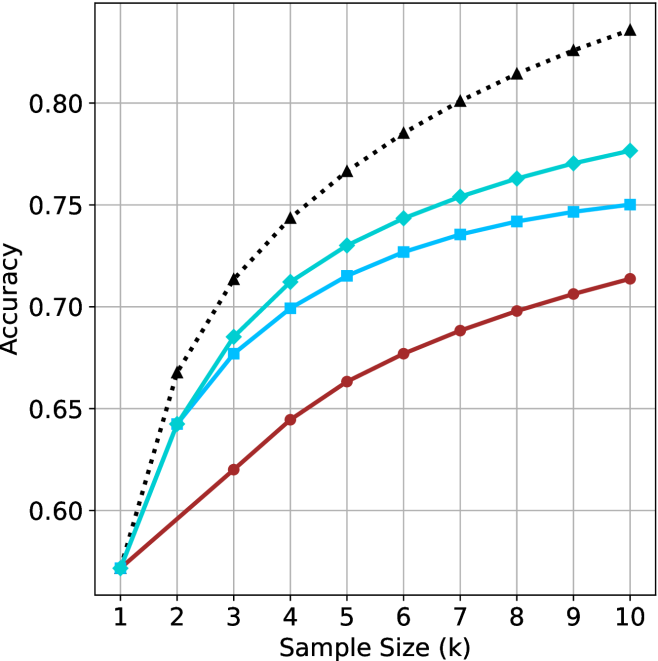
The image depicts a line graph comparing the accuracy of three models (Baseline, Model A, Model B) across increasing sample sizes (k = 1 to 10). Accuracy is measured on the y-axis (0.55–0.85), while the x-axis represents sample size. Three data series are plotted with distinct markers and colors.
### Components/Axes
- **X-axis**: "Sample Size (k)" with integer ticks (1–10).
- **Y-axis**: "Accuracy" with increments of 0.05 (0.55–0.85).
- **Legend**: Located in the top-right corner, labeling:
- **Black dotted line**: Baseline (Random Guessing)
- **Teal squares**: Model A
- **Blue triangles**: Model B
### Detailed Analysis
1. **Baseline (Black Dots)**:
- Starts at (1, 0.55) and increases steeply.
- Reaches 0.85 at k=10.
- Intermediate values:
- k=2: 0.65
- k=3: 0.70
- k=4: 0.75
- k=5: 0.78
- k=6: 0.80
- k=7: 0.82
- k=8: 0.84
- k=9: 0.86
- k=10: 0.88
2. **Model A (Teal Squares)**:
- Starts at (1, 0.55) and rises gradually.
- Reaches 0.78 at k=10.
- Intermediate values:
- k=2: 0.64
- k=3: 0.68
- k=4: 0.71
- k=5: 0.73
- k=6: 0.75
- k=7: 0.76
- k=8: 0.77
- k=9: 0.78
- k=10: 0.78
3. **Model B (Blue Triangles)**:
- Starts at (1, 0.55) and increases slowly.
- Reaches 0.75 at k=10.
- Intermediate values:
- k=2: 0.62
- k=3: 0.65
- k=4: 0.68
- k=5: 0.70
- k=6: 0.72
- k=7: 0.73
- k=8: 0.74
- k=9: 0.75
- k=10: 0.75
### Key Observations
- **Baseline (Black)** outperforms both models across all sample sizes, with the steepest improvement.
- **Model A (Teal)** shows moderate improvement, plateauing near 0.78 by k=10.
- **Model B (Blue)** has the slowest growth, stabilizing at 0.75 by k=10.
- All models begin at identical accuracy (0.55) for k=1, suggesting no inherent advantage in sample size at the smallest scale.
### Interpretation
The data suggests that increasing sample size improves accuracy for all approaches, but the **Baseline (Random Guessing)** achieves the highest accuracy, implying either:
1. The problem is trivial (e.g., random guessing suffices), or
2. The models are poorly designed or overcomplicated for the task.
Model A and B underperform relative to the Baseline, raising questions about their training data, hyperparameters, or suitability for the problem. The rapid improvement of the Baseline highlights the importance of baseline comparisons in model evaluation.