## Line Graph: Average Incorrect Flips vs Iteration
### Overview
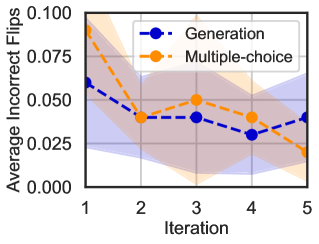
The image is a line graph comparing the performance of two methods ("Generation" and "Multiple-choice") across five iterations. The y-axis represents "Average Incorrect Flips" (ranging from 0.000 to 0.100), and the x-axis represents "Iteration" (1 to 5). Shaded regions around the lines indicate confidence intervals or variability.
### Components/Axes
- **X-axis (Iteration)**: Labeled "Iteration" with ticks at 1, 2, 3, 4, 5.
- **Y-axis (Average Incorrect Flips)**: Labeled "Average Incorrect Flips" with ticks at 0.000, 0.025, 0.050, 0.075, 0.100.
- **Legend**: Located in the top-right corner, with:
- **Blue dashed line**: "Generation"
- **Orange dashed line**: "Multiple-choice"
- **Shaded Regions**: Light blue (Generation) and light orange (Multiple-choice) bands around the lines, representing variability.
### Detailed Analysis
#### Generation (Blue Dashed Line)
- **Iteration 1**: ~0.06
- **Iteration 2**: ~0.04
- **Iteration 3**: ~0.04
- **Iteration 4**: ~0.03
- **Iteration 5**: ~0.04
- **Trend**: Decreases from 0.06 (Iteration 1) to 0.03 (Iteration 4), then slightly increases to 0.04 (Iteration 5). Confidence interval widens at Iterations 1 and 5.
#### Multiple-choice (Orange Dashed Line)
- **Iteration 1**: ~0.08
- **Iteration 2**: ~0.05
- **Iteration 3**: ~0.06
- **Iteration 4**: ~0.04
- **Iteration 5**: ~0.03
- **Trend**: Starts at 0.08 (Iteration 1), dips to 0.05 (Iteration 2), fluctuates to 0.06 (Iteration 3), then decreases to 0.03 (Iteration 5). Confidence interval widens at Iteration 3.
### Key Observations
1. Both methods show improvement in reducing incorrect flips over iterations.
2. "Multiple-choice" starts with higher incorrect flips (0.08) but ends lower (0.03) than "Generation" (0.04) by Iteration 5.
3. "Generation" exhibits a more stable trend, while "Multiple-choice" has greater variability (e.g., peak at Iteration 3).
4. Confidence intervals overlap significantly at Iterations 2 and 4, suggesting uncertainty in performance differences.
### Interpretation
The data suggests that "Multiple-choice" may outperform "Generation" in later iterations, despite higher initial variability. The final drop in "Multiple-choice" (Iteration 5) could indicate adaptive learning or optimization. However, the overlapping confidence intervals imply that the difference between methods is not statistically definitive in all iterations. The shaded regions highlight that "Generation" has higher uncertainty in early and late iterations, while "Multiple-choice" shows greater variability in mid-iterations. This might reflect differing algorithmic behaviors or sensitivity to input changes.