## Chart: Average Incorrect Flips vs. Iteration
### Overview
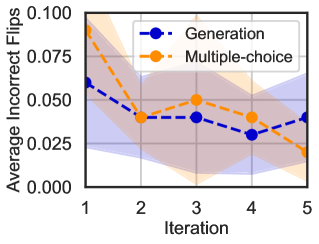
The image is a line chart comparing the average incorrect flips for two methods, "Generation" and "Multiple-choice," across five iterations. The chart displays the mean values as lines and the variance as shaded regions around the lines.
### Components/Axes
* **X-axis:** Iteration (labeled 1 to 5)
* **Y-axis:** Average Incorrect Flips (labeled 0.000 to 0.100, incrementing by 0.025)
* **Legend:** Located in the top-right corner.
* Blue line with circles: Generation
* Orange dashed line with circles: Multiple-choice
### Detailed Analysis
* **Generation (Blue Line):**
* Trend: Generally decreasing, then slightly increasing.
* Iteration 1: Approximately 0.06
* Iteration 2: Approximately 0.04
* Iteration 3: Approximately 0.04
* Iteration 4: Approximately 0.03
* Iteration 5: Approximately 0.04
* The shaded region around the blue line indicates the variance in the Generation data.
* **Multiple-choice (Orange Dashed Line):**
* Trend: Decreasing, then increasing, then decreasing again.
* Iteration 1: Approximately 0.09
* Iteration 2: Approximately 0.04
* Iteration 3: Approximately 0.05
* Iteration 4: Approximately 0.04
* Iteration 5: Approximately 0.02
* The shaded region around the orange line indicates the variance in the Multiple-choice data.
### Key Observations
* The Multiple-choice method starts with a higher average of incorrect flips but decreases more rapidly than the Generation method.
* Both methods show a decrease in average incorrect flips over the iterations, but the Generation method's decrease is less pronounced.
* The variance (shaded regions) appears to be larger for the Multiple-choice method, especially in the earlier iterations.
### Interpretation
The chart suggests that both the Generation and Multiple-choice methods improve (reduce incorrect flips) over iterations. The Multiple-choice method initially performs worse but shows a more significant improvement. The larger variance in the Multiple-choice method might indicate that its performance is more sensitive to the specific iteration or that there is more variability in the data. The Generation method is more stable, with less variance, but its overall improvement is less pronounced.