\n
## Line Chart: Average Incorrect Flips vs. Iteration
### Overview
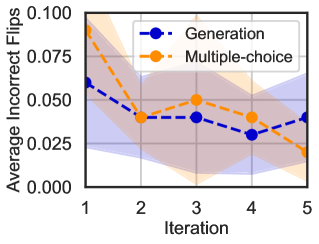
This image presents a line chart illustrating the trend of "Average Incorrect Flips" over "Iteration" for two different methods: "Generation" and "Multiple-choice". The chart also displays confidence intervals around each line, represented by shaded regions.
### Components/Axes
* **X-axis:** "Iteration", ranging from 1 to 5.
* **Y-axis:** "Average Incorrect Flips", ranging from 0.000 to 0.100.
* **Data Series 1:** "Generation" - Represented by a blue dashed line with circular markers.
* **Data Series 2:** "Multiple-choice" - Represented by an orange dashed line with circular markers.
* **Legend:** Located in the top-right corner, associating colors with the methods.
* **Confidence Intervals:** Shaded regions around each line, colored light blue for "Generation" and light orange for "Multiple-choice".
### Detailed Analysis
**Generation (Blue Line):**
The blue line representing "Generation" initially starts at approximately 0.063 at Iteration 1. It then slopes downward, reaching a minimum of approximately 0.028 at Iteration 4. It then increases slightly to approximately 0.033 at Iteration 5. The confidence interval is relatively wide, especially at the beginning, indicating greater uncertainty.
* Iteration 1: ~0.063
* Iteration 2: ~0.052
* Iteration 3: ~0.042
* Iteration 4: ~0.028
* Iteration 5: ~0.033
**Multiple-choice (Orange Line):**
The orange line representing "Multiple-choice" begins at approximately 0.085 at Iteration 1. It decreases sharply to approximately 0.048 at Iteration 2, then continues to decrease, reaching a minimum of approximately 0.025 at Iteration 3. It then increases to approximately 0.038 at Iteration 4 and finally to approximately 0.042 at Iteration 5. The confidence interval is also wide, but appears slightly narrower than that of "Generation".
* Iteration 1: ~0.085
* Iteration 2: ~0.048
* Iteration 3: ~0.025
* Iteration 4: ~0.038
* Iteration 5: ~0.042
### Key Observations
* Both methods show a decreasing trend in "Average Incorrect Flips" as the "Iteration" number increases, suggesting improvement in performance with each iteration.
* The "Multiple-choice" method starts with a higher error rate than "Generation" but converges to a similar level of accuracy by Iteration 5.
* The confidence intervals indicate that the observed differences between the methods, particularly at the beginning, may not be statistically significant.
* The "Generation" method appears to have a more stable performance across iterations, as indicated by the relatively consistent slope of the line.
### Interpretation
The chart suggests that both the "Generation" and "Multiple-choice" methods improve their performance (reduce incorrect flips) with each iteration. The initial higher error rate of the "Multiple-choice" method could be due to a more challenging initial state or a slower learning curve. The convergence of the two methods towards the end suggests that both approaches are capable of achieving similar levels of accuracy given enough iterations. The wide confidence intervals highlight the inherent variability in the results and the need for further investigation to determine whether the observed differences are statistically significant. The data implies that iterative refinement is beneficial for both methods, but the optimal number of iterations may vary depending on the specific application and desired level of accuracy.