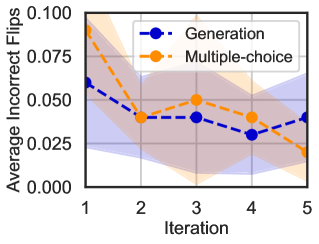
## Line Chart: Average Incorrect Flips vs. Iteration
### Overview
The image is a line chart comparing the performance of two methods, "Generation" and "Multiple-choice," over five iterations. The performance metric is the "Average Incorrect Flips," where a lower value indicates better performance. Each data series is represented by a line with circular markers and a shaded region indicating the confidence interval or variance around the mean.
### Components/Axes
* **X-Axis (Horizontal):**
* **Label:** "Iteration"
* **Scale:** Linear, with discrete integer markers at 1, 2, 3, 4, and 5.
* **Y-Axis (Vertical):**
* **Label:** "Average Incorrect Flips"
* **Scale:** Linear, ranging from 0.000 to 0.100, with major tick marks at 0.000, 0.025, 0.050, 0.075, and 0.100.
* **Legend:**
* **Position:** Top-right corner of the plot area.
* **Series 1:** "Generation" - Represented by a blue line with blue circular markers and a light blue shaded confidence interval.
* **Series 2:** "Multiple-choice" - Represented by an orange line with orange circular markers and a light orange shaded confidence interval.
### Detailed Analysis
**Data Series: Generation (Blue Line)**
* **Trend:** The line shows a general downward trend from iteration 1 to 4, with a slight upward tick at iteration 5. The confidence interval is widest at the first iteration and narrows considerably by the fifth.
* **Approximate Data Points:**
* Iteration 1: ~0.060
* Iteration 2: ~0.040
* Iteration 3: ~0.040
* Iteration 4: ~0.030
* Iteration 5: ~0.040
**Data Series: Multiple-choice (Orange Line)**
* **Trend:** The line shows a steep initial decline from iteration 1 to 2, followed by a moderate increase at iteration 3, and then a steady decline through iterations 4 and 5. The confidence interval is very wide at iteration 1 and narrows significantly by iteration 5.
* **Approximate Data Points:**
* Iteration 1: ~0.090
* Iteration 2: ~0.040
* Iteration 3: ~0.050
* Iteration 4: ~0.040
* Iteration 5: ~0.020
### Key Observations
1. **Initial Performance Gap:** At iteration 1, the "Multiple-choice" method has a substantially higher average incorrect flips (~0.090) compared to the "Generation" method (~0.060).
2. **Convergence at Iteration 2:** Both methods converge to a similar performance level of approximately 0.040 at iteration 2.
3. **Final Performance Divergence:** By iteration 5, the "Multiple-choice" method achieves the lowest observed value (~0.020), outperforming the "Generation" method (~0.040).
4. **Confidence Interval Behavior:** For both series, the shaded confidence intervals are widest at the first iteration and become progressively narrower, suggesting that the variance in performance decreases as the number of iterations increases.
5. **Crossover Point:** The two lines cross between iterations 1 and 2, and again between iterations 4 and 5, indicating a shift in which method is superior at different stages of the process.
### Interpretation
The chart demonstrates the learning or optimization curves for two different approaches. The "Multiple-choice" method starts with poorer performance but exhibits a more dramatic improvement, ultimately achieving the best result by the final iteration. The "Generation" method shows more consistent, moderate improvement but plateaus at a higher error rate.
The narrowing confidence intervals suggest that both methods become more reliable and consistent in their outputs as they are applied iteratively. The crossover points are critical; they indicate that the optimal method depends on the stage of the process. If only a few iterations are possible, "Generation" may be preferable initially. However, for a process allowing for five or more iterations, "Multiple-choice" appears to be the more effective strategy for minimizing incorrect flips. The data suggests an initial phase of rapid learning for "Multiple-choice," followed by a refinement phase where it surpasses the more steadily improving "Generation" method.