## Line Chart: Reward vs Steps (Mean Min/Max)
### Overview
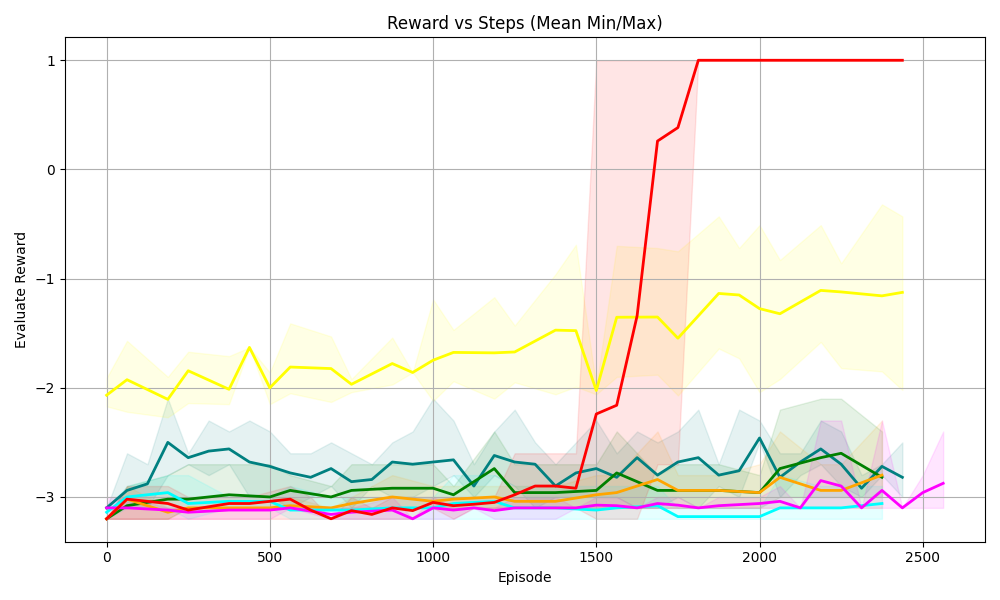
The chart visualizes the evaluation reward performance of multiple algorithms across training episodes. It shows mean rewards with shaded regions representing minimum/maximum variability. The x-axis tracks training progress (episodes), while the y-axis measures reward values. A notable anomaly occurs in the red line (A2C algorithm) around episode 1500, where reward abruptly jumps from -3 to 1.
### Components/Axes
- **X-axis (Episode)**:
- Label: "Episode"
- Scale: 0 to 2500 (increments of 500)
- Position: Bottom of chart
- **Y-axis (Evaluation Reward)**:
- Label: "Evaluation Reward"
- Scale: -3 to 1 (increments of 1)
- Position: Left side of chart
- **Legend**:
- Located on the right side
- Colors and labels:
- Red: A2C
- Yellow: PPO
- Green: SAC
- Blue: DDPG
- Cyan: TD3
- Magenta: DQN
- Shaded regions indicate min/max variability for each algorithm
### Detailed Analysis
1. **A2C (Red Line)**:
- Sharp upward spike at ~1500 episodes (reward jumps from -3 to 1)
- Maintains reward=1 from ~1700 episodes onward
- Shaded region narrows significantly after 1500 episodes
2. **PPO (Yellow Line)**:
- Gradual improvement from -2 to -1.2 by 2500 episodes
- Consistent variability (shaded region width ~0.5 throughout)
3. **SAC (Green Line)**:
- Stable performance between -3 and -2.5
- Moderate variability (shaded region width ~0.3)
4. **DDPG (Blue Line)**:
- Fluctuates between -3.2 and -2.8
- High variability (shaded region width ~0.4)
5. **TD3 (Cyan Line)**:
- Slight improvement from -3.1 to -2.9
- Low variability (shaded region width ~0.2)
6. **DQN (Magenta Line)**:
- Worst performance (-3.2 to -2.7)
- Highest variability (shaded region width ~0.5)
### Key Observations
- A2C demonstrates a dramatic performance improvement (~4x reward increase) after 1500 episodes
- All algorithms show negative rewards, but A2C achieves the highest value (1)
- Variability (shaded regions) correlates with algorithm stability:
- DQN and DDPG show highest instability
- TD3 shows most consistent performance
- No algorithm maintains perfect stability (all have shaded regions)
### Interpretation
The data suggests A2C exhibits emergent capabilities at later training stages, potentially due to architectural advantages in handling complex reward structures. The sharp reward increase at 1500 episodes implies a phase transition in learning dynamics. Lower variability in TD3 indicates more reliable convergence properties compared to other algorithms. The persistent negative rewards across all algorithms suggest the task remains challenging, with A2C being the only one to achieve positive rewards through its unique scaling behavior.