## Chart: Cost per Sequence vs. Sequence Number
### Overview
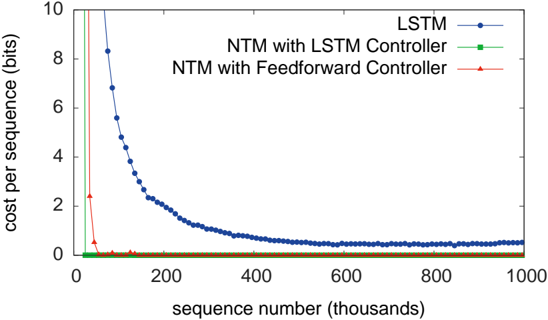
The image is a line chart comparing the cost per sequence (in bits) for three different models: LSTM, NTM with LSTM Controller, and NTM with Feedforward Controller, as a function of the sequence number (in thousands). The chart shows how the cost changes as the models process more sequences.
### Components/Axes
* **X-axis:** Sequence number (thousands), ranging from 0 to 1000. Axis markers are present at intervals of 200 (0, 200, 400, 600, 800, 1000).
* **Y-axis:** Cost per sequence (bits), ranging from 0 to 10. Axis markers are present at intervals of 2 (0, 2, 4, 6, 8, 10).
* **Legend (top-right):**
* Blue line with circles: LSTM
* Green line with squares: NTM with LSTM Controller
* Red line with triangles: NTM with Feedforward Controller
### Detailed Analysis
* **LSTM (Blue):** The cost per sequence starts high (around 8.3 bits at sequence number 50) and rapidly decreases as the sequence number increases. The curve flattens out after approximately 400,000 sequences, approaching a cost of approximately 0.3 bits.
* Sequence 50: ~8.3 bits
* Sequence 100: ~4.7 bits
* Sequence 200: ~1.8 bits
* Sequence 400: ~0.4 bits
* Sequence 600: ~0.3 bits
* Sequence 800: ~0.3 bits
* Sequence 1000: ~0.3 bits
* **NTM with LSTM Controller (Green):** The cost per sequence starts high (around 9.8 bits at sequence number 10) and quickly drops to near zero. It remains consistently low (approximately 0.05 bits) throughout the entire range of sequence numbers.
* Sequence 10: ~9.8 bits
* Sequence 50: ~0.05 bits
* Sequence 100: ~0.05 bits
* Sequence 200: ~0.05 bits
* Sequence 400: ~0.05 bits
* Sequence 600: ~0.05 bits
* Sequence 800: ~0.05 bits
* Sequence 1000: ~0.05 bits
* **NTM with Feedforward Controller (Red):** The cost per sequence starts high (around 2.5 bits at sequence number 10) and quickly drops to near zero. It remains consistently low (approximately 0.05 bits) throughout the entire range of sequence numbers.
* Sequence 10: ~2.5 bits
* Sequence 50: ~0.05 bits
* Sequence 100: ~0.05 bits
* Sequence 200: ~0.05 bits
* Sequence 400: ~0.05 bits
* Sequence 600: ~0.05 bits
* Sequence 800: ~0.05 bits
* Sequence 1000: ~0.05 bits
### Key Observations
* The LSTM model initially has a much higher cost per sequence compared to the NTM models.
* The cost per sequence for the LSTM model decreases significantly as the sequence number increases, eventually approaching a similar level to the NTM models.
* The NTM models (both with LSTM and Feedforward controllers) exhibit a very low and stable cost per sequence across all sequence numbers.
* The NTM with LSTM Controller and NTM with Feedforward Controller perform almost identically.
### Interpretation
The chart suggests that NTM models, regardless of the controller type (LSTM or Feedforward), are more efficient in terms of cost per sequence compared to a standalone LSTM model, especially at the beginning of the learning process. The LSTM model, however, improves with more training data (larger sequence numbers) and eventually approaches the performance of the NTM models. This indicates that NTM models may be better suited for tasks where quick learning and consistent performance are crucial, while LSTM models may require more training to achieve comparable results. The near-identical performance of the two NTM models suggests that the choice of controller (LSTM or Feedforward) has minimal impact on the overall performance of the NTM architecture in this specific scenario.