\n
## Bar Chart: Unfaithful Pairs of Questions (%) by AI Model
### Overview
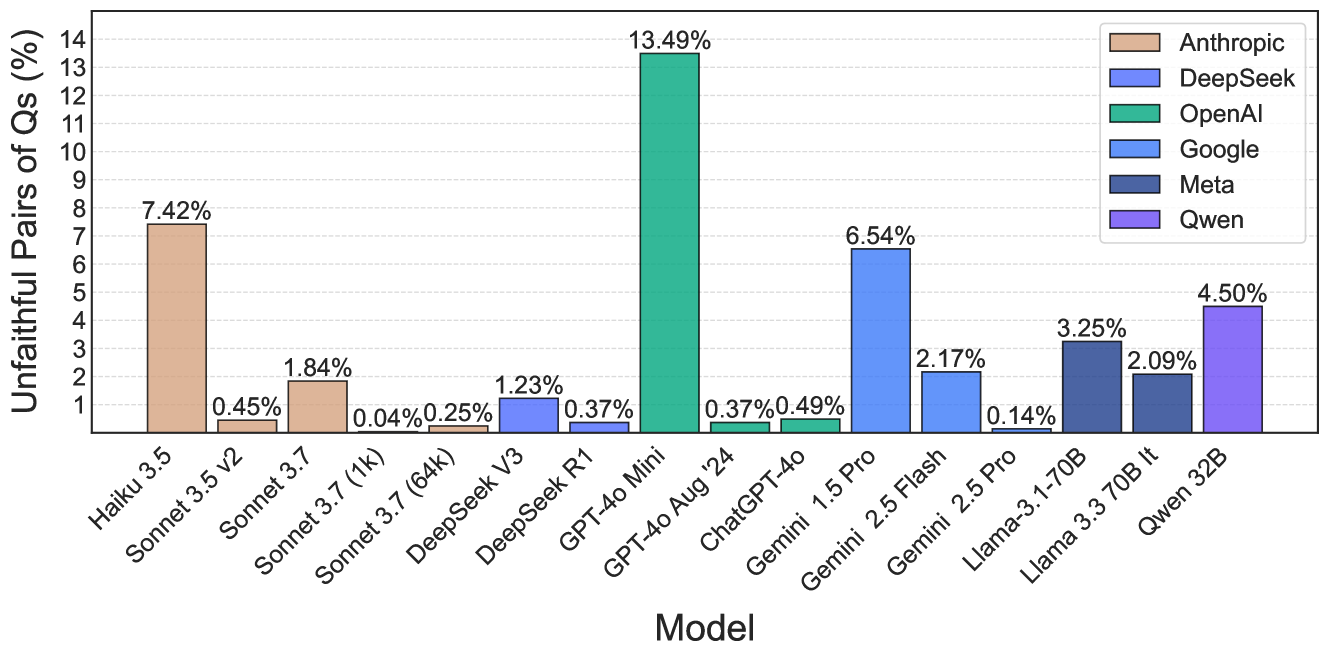
This is a vertical bar chart comparing the percentage of "Unfaithful Pairs of Qs" across 16 different large language models from six different companies. The chart quantifies a specific performance metric, likely related to model faithfulness or consistency, with lower percentages indicating better performance.
### Components/Axes
* **Chart Type:** Vertical bar chart.
* **Y-Axis:** Labeled **"Unfaithful Pairs of Qs (%)"**. The scale runs from 0 to 14, with major tick marks at every integer (1, 2, 3... 14).
* **X-Axis:** Labeled **"Model"**. It lists 16 specific model names.
* **Legend:** Located in the **top-right corner** of the chart area. It maps colors to company names:
* Tan: **Anthropic**
* Light Blue: **DeepSeek**
* Green: **OpenAI**
* Medium Blue: **Google**
* Dark Blue: **Meta**
* Purple: **Qwen**
* **Data Labels:** Each bar has its exact percentage value displayed directly above it.
### Detailed Analysis
The following table lists each model, its associated company (based on bar color and legend), and the exact percentage of unfaithful pairs shown.
| Model Name | Company (Legend Color) | Unfaithful Pairs of Qs (%) |
| :--- | :--- | :--- |
| Haiku 3.5 | Anthropic (Tan) | 7.42% |
| Sonnet 3.5 V2 | Anthropic (Tan) | 0.45% |
| Sonnet 3.7 | Anthropic (Tan) | 1.84% |
| Sonnet 3.7 (1k) | Anthropic (Tan) | 0.04% |
| Sonnet 3.7 (64k) | Anthropic (Tan) | 0.25% |
| DeepSeek V3 | DeepSeek (Light Blue) | 1.23% |
| DeepSeek R1 | DeepSeek (Light Blue) | 0.37% |
| GPT-4o Mini | OpenAI (Green) | 13.49% |
| GPT-4o Aug '24 | OpenAI (Green) | 0.37% |
| ChatGPT-4o | OpenAI (Green) | 0.49% |
| Gemini 1.5 Pro | Google (Medium Blue) | 6.54% |
| Gemini 2.5 Flash | Google (Medium Blue) | 2.17% |
| Gemini 2.5 Pro | Google (Medium Blue) | 0.14% |
| Llama-3.1-70B | Meta (Dark Blue) | 3.25% |
| Llama 3.3 70B lt | Meta (Dark Blue) | 2.09% |
| Qwen 32B | Qwen (Purple) | 4.50% |
**Visual Trend Verification:** The bars show significant variation in height. There is no single monotonic trend across all models. The tallest bar (GPT-4o Mini) is dramatically higher than all others. The shortest bars (e.g., Sonnet 3.7 (1k) at 0.04%, Gemini 2.5 Pro at 0.14%) are barely visible.
### Key Observations
1. **Extreme Outlier:** **GPT-4o Mini** has a drastically higher unfaithful pair rate (13.49%) than any other model, being more than double the next highest value.
2. **Company Performance Spread:** There is high variance within companies.
* **Anthropic:** Ranges from 0.04% (Sonnet 3.7 (1k)) to 7.42% (Haiku 3.5).
* **OpenAI:** Contains both the highest (13.49%) and some of the lowest values (0.37%, 0.49%).
* **Google:** Shows a clear descending trend from Gemini 1.5 Pro (6.54%) to Gemini 2.5 Pro (0.14%).
3. **Lowest Performers:** The models with the best (lowest) scores are **Sonnet 3.7 (1k)** (0.04%), **Gemini 2.5 Pro** (0.14%), and **Sonnet 3.7 (64k)** (0.25%).
4. **Context Window Note:** For Anthropic's Sonnet 3.7, the variant with a 1k context window (0.04%) performs significantly better on this metric than the 64k variant (0.25%).
### Interpretation
This chart presents a benchmark for "faithfulness" in AI model responses, where a lower percentage of unfaithful pairs is desirable. The data suggests that model architecture, training, and possibly context window size have a profound impact on this specific metric.
The most striking finding is the performance of **GPT-4o Mini**, which is a significant outlier. This could indicate a specific trade-off made in its design (e.g., prioritizing speed or cost over faithfulness) or a potential issue with how it handles the specific task used to generate this benchmark.
The wide performance range within single companies (like Anthropic and OpenAI) demonstrates that "faithfulness" is not a fixed attribute of a company's models but varies greatly between different model versions and sizes. The strong performance of the latest Google Gemini 2.5 Pro and specific Anthropic Sonnet 3.7 variants suggests recent advancements are effectively addressing this issue for some models. The chart serves as a comparative tool for evaluating model reliability on tasks requiring consistent, faithful outputs.