# Technical Document Extraction: E. DUPOUX Chart Analysis
## 1. **Chart Overview**
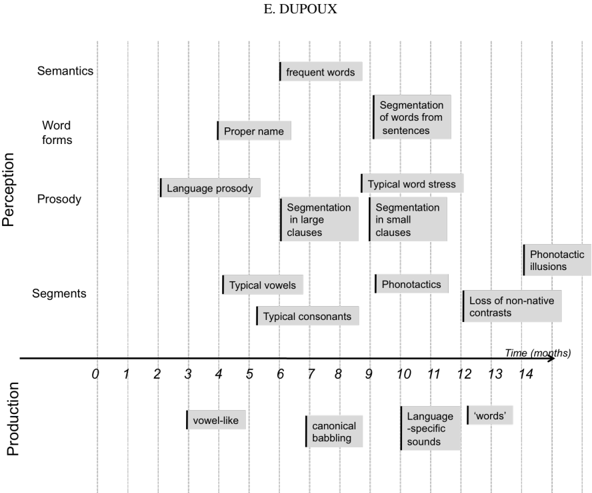
The image is a **categorical chart** titled **"E. DUPOUX"**. It visualizes the relationship between **Perception** (y-axis) and **Production** (x-axis) over **Time (months)** (x-axis, 0–14). The chart uses **gray rectangular boxes** to represent data points, with labels indicating specific linguistic phenomena.
---
## 2. **Axis Labels and Markers**
- **Y-Axis (Perception):**
- Categories:
- **Semantics**
- **Word forms**
- **Prosody**
- **Segments**
- No numerical scale; categorical labels only.
- **X-Axis (Production):**
- Title: **"Time (months)"**
- Markers: **0, 1, 2, 3, 4, 5, 6, 7, 8, 9, 10, 11, 12, 13, 14**
- No numerical scale; categorical time intervals.
---
## 3. **Key Data Points and Labels**
The chart contains **14 gray boxes** (data points) with labels, positioned at specific **Time (months)** and **Perception** categories. Below is a complete list of labels and their coordinates:
### **Semantics**
- **frequent words** (x=6, y=Semantics)
### **Word forms**
- **Proper name** (x=5, y=Word forms)
- **Segmentation of words from sentences** (x=10, y=Word forms)
### **Prosody**
- **Language prosody** (x=3, y=Prosody)
- **Segmentation in large clauses** (x=6, y=Prosody)
- **Segmentation in small clauses** (x=9, y=Prosody)
### **Segments**
- **vowel-like** (x=4, y=Segments)
- **canonical babbling** (x=7, y=Segments)
- **Typical vowels** (x=5, y=Segments)
- **Typical consonants** (x=6, y=Segments)
- **Phonotactics** (x=10, y=Segments)
- **Loss of non-native contrasts** (x=13, y=Segments)
- **Phonotactic illusions** (x=14, y=Segments)
---
## 4. **Legend and Color Analysis**
- **Legend:** **No legend** is present in the image.
- **Color Consistency:** All boxes are **gray**, with no variation in color. Since no legend exists, color coding cannot be cross-referenced.
---
## 5. **Trend Verification**
- **Visual Trends:**
- **Semantics** and **Word forms** show early emergence (e.g., "frequent words" at 6 months, "Proper name" at 5 months).
- **Prosody** and **Segments** dominate later time intervals (e.g., "Segmentation in small clauses" at 9 months, "Phonotactic illusions" at 14 months).
- **Segments** exhibit the most diverse and extended timeline (4–14 months).
---
## 6. **Component Isolation**
- **Header:** Title **"E. DUPOUX"** (centered at the top).
- **Main Chart:**
- Axes labeled **"Perception"** (y-axis) and **"Time (months)"** (x-axis).
- Gray boxes with labels representing linguistic phenomena.
- **Footer:** No explicit footer; the chart ends at x=14.
---
## 7. **Additional Notes**
- **Language:** All text is in **English**.
- **Data Structure:** The chart is **not a heatmap** or **data table**; it is a **categorical diagram** with labeled boxes.
- **Missing Elements:** No numerical data, no color-coded legend, and no explicit explanation of the chart's purpose or methodology.
---
## 8. **Conclusion**
This chart illustrates the **temporal progression of linguistic perception and production** across four categories (Semantics, Word forms, Prosody, Segments). Key phenomena like **"frequent words"** and **"Phonotactic illusions"** are mapped to specific time intervals, suggesting a developmental or acquisition timeline. However, the absence of a legend or numerical data limits deeper analytical interpretation.