## Line Graph: Model Accuracy vs. Sample Size
### Overview
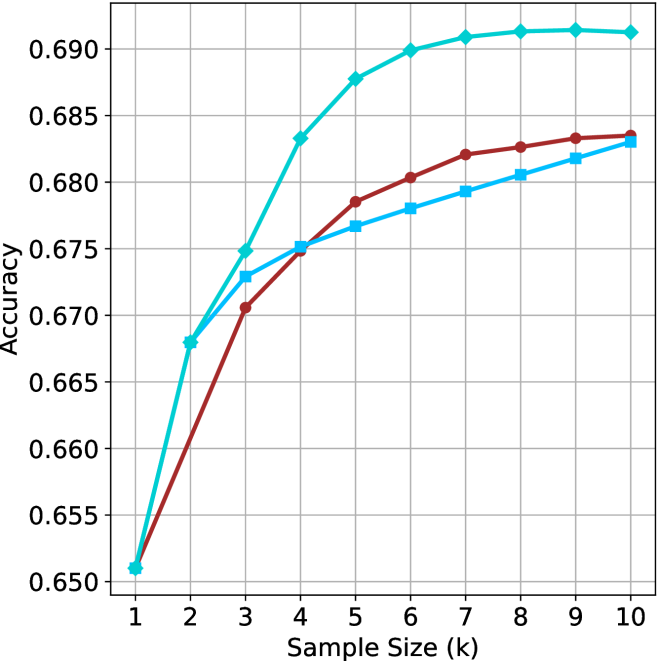
The graph compares the accuracy of three machine learning models (Model A, Model B, Model C) across increasing sample sizes (k = 1 to 10). Accuracy is measured on a scale from 0.650 to 0.690. All models show improvement with larger sample sizes, but their performance trajectories differ significantly.
### Components/Axes
- **X-axis**: Sample Size (k) – Integer values from 1 to 10.
- **Y-axis**: Accuracy – Decimal values from 0.650 to 0.690.
- **Legend**: Located in the top-right corner, associating:
- Teal line → Model A
- Red line → Model B
- Blue line → Model C
### Detailed Analysis
1. **Model A (Teal Line)**:
- Starts at **0.665** (k=1), jumps to **0.675** (k=2), then rises sharply to **0.685** (k=5).
- Plateaus at **~0.690** from k=6 to k=10.
- **Key Trend**: Rapid improvement early, then stabilization at peak accuracy.
2. **Model B (Red Line)**:
- Begins at **0.650** (k=1), rises steadily to **0.670** (k=3), **0.675** (k=4), and **0.680** (k=5).
- Gradual increase to **0.686** by k=10.
- **Key Trend**: Consistent upward slope with no plateau.
3. **Model C (Blue Line)**:
- Starts at **0.665** (k=1), increases to **0.675** (k=3), **0.680** (k=5), and **0.685** (k=10).
- **Key Trend**: Steady but slower growth compared to Models A and B.
### Key Observations
- **Model A** achieves the highest accuracy (0.690) but plateaus early, suggesting diminishing returns after k=5.
- **Model B** starts with the lowest accuracy but surpasses Model C by k=7, ending at 0.686.
- **Model C** shows the most gradual improvement, ending at 0.685, trailing Model B by k=10.
- All models converge toward similar accuracy levels by k=10, but Model A maintains a lead.
### Interpretation
The data suggests **Model A** is the most efficient, achieving peak performance quickly and maintaining it. **Model B** demonstrates strong scalability, closing the gap with Model A by k=10. **Model C** lags behind, indicating potential limitations in its architecture or training process. The plateau in Model A’s accuracy implies that increasing sample size beyond k=5 yields minimal gains, while Models B and C continue to benefit from larger datasets. This could reflect differences in model complexity, optimization, or data utilization strategies.