## 3D Cube Diagram: Source, Destination, Case with SRAM Capacity
### Overview
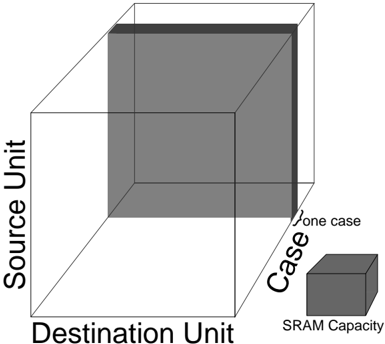
The image is a 3D cube diagram illustrating the relationship between "Source Unit", "Destination Unit", and "Case". A smaller cube labeled "SRAM Capacity" is positioned near the "Case" axis. The diagram appears to represent a conceptual model, possibly related to data processing or memory allocation.
### Components/Axes
* **Axes:**
* X-axis: "Destination Unit"
* Y-axis: "Source Unit"
* Z-axis: "Case"
* **Labels:**
* "one case" - Located near the Z-axis ("Case")
* "SRAM Capacity" - Label for the smaller cube.
* **Cube Representation:**
* The larger cube represents the overall space defined by the three axes.
* A shaded region is present on the top and right faces of the larger cube.
* The smaller cube represents "SRAM Capacity".
### Detailed Analysis or Content Details
* **Axes Labels:** The axes are labeled "Source Unit", "Destination Unit", and "Case".
* **Large Cube:** The large cube has a shaded area on its top and right faces, indicating a specific region or condition within the overall space.
* **Small Cube:** The small cube, labeled "SRAM Capacity", is located near the "Case" axis, suggesting a relationship between the case and SRAM capacity.
* **"one case" Label:** The label "one case" is positioned close to the "Case" axis, possibly indicating a specific instance or scenario.
### Key Observations
* The diagram uses a 3D cube to represent a relationship between three variables: Source Unit, Destination Unit, and Case.
* The "SRAM Capacity" is represented as a separate, smaller cube, suggesting it's a factor related to the "Case".
* The shaded region on the large cube might represent a specific condition or constraint within the overall space.
### Interpretation
The diagram likely represents a conceptual model for understanding the relationship between data sources, destinations, and different cases, with SRAM capacity being a relevant factor. The shaded region on the large cube could indicate a specific operational range or constraint. The diagram suggests that SRAM capacity is somehow related to the "Case" dimension, possibly indicating that different cases require different amounts of SRAM. The diagram does not provide specific numerical data, but rather a visual representation of the relationships between these components.