\n
## Diagram: 3D Representation of Data Transfer
### Overview
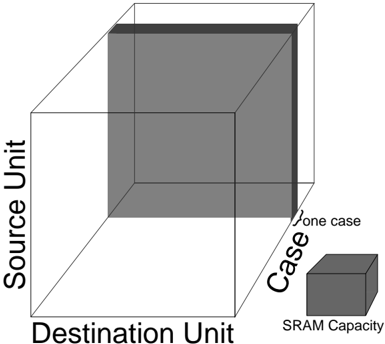
The image depicts a three-dimensional diagram representing a data transfer scenario. The diagram uses a cube to visualize the relationship between "Source Unit", "Destination Unit", and "Case" (specifically, "SRAM Capacity"). A shaded volume within the cube represents "one case". The diagram appears to be conceptual, illustrating a space defined by these three parameters.
### Components/Axes
* **X-axis:** Destination Unit
* **Y-axis:** Source Unit
* **Z-axis:** Case (SRAM Capacity)
* **Shaded Volume:** Represents "one case"
* **Small Cube (bottom-right):** Labeled "Case" and "SRAM Capacity". This appears to be a visual representation of the Z-axis dimension.
### Detailed Analysis or Content Details
The diagram does not contain specific numerical data. It is a visual representation of a three-dimensional space. The axes are labeled, but there are no scale markings or specific values indicated. The shaded volume occupies a significant portion of the cube, suggesting a substantial range of possibilities within the defined space. The "one case" label indicates that the shaded volume represents a single instance or scenario within the overall parameter space.
### Key Observations
The diagram emphasizes the interplay between the source and destination units, and the capacity of the case (SRAM). The shading suggests a defined region within this space, representing a specific data transfer scenario. The lack of numerical values implies that the diagram is intended to be a conceptual illustration rather than a precise data representation.
### Interpretation
The diagram likely represents a system where data is transferred from a "Source Unit" to a "Destination Unit", and the amount of data that can be transferred in a single operation is limited by the "SRAM Capacity" (represented by the "Case"). The shaded volume could represent the feasible region for data transfer, given the constraints of the source and destination units and the available SRAM capacity. The diagram suggests that the data transfer process is influenced by all three parameters, and that the size of the "Case" (SRAM Capacity) plays a crucial role in determining the amount of data that can be moved. The diagram is a high-level visualization of a data transfer process, focusing on the relationships between key parameters rather than specific data values. It could be used to illustrate the concept of data transfer limitations or to visualize the design space for a data transfer system.