## Diagram: 3D Conceptual Cube of SRAM Capacity Allocation
### Overview
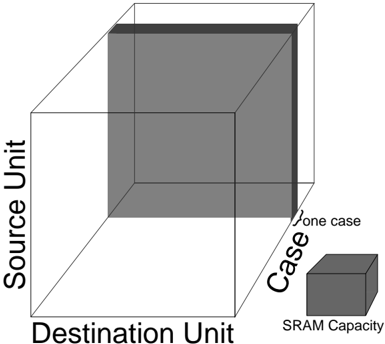
The image is a black-and-white technical diagram illustrating a three-dimensional conceptual model of memory allocation. It uses a large wireframe cube to represent a total capacity space defined by three axes, with a smaller solid cube inside representing a single allocated unit. A separate legend cube clarifies the meaning of the solid cube.
### Components/Axes
* **Main Structure:** A large, transparent wireframe cube shown in a 3D isometric perspective.
* **Axes Labels:**
* **Vertical Axis (Left):** Labeled "Source Unit". This axis runs from the bottom to the top of the cube's front face.
* **Horizontal Axis (Bottom):** Labeled "Destination Unit". This axis runs from left to right along the cube's front face.
* **Depth Axis (Receding to the right):** Labeled "Case". This axis runs from the front face towards the back of the cube.
* **Internal Element:** A smaller, solid gray cube is positioned inside the large wireframe cube. It is located in the **top-right-front** corner, meaning it has high values on the "Source Unit" and "Destination Unit" axes and is at the front along the "Case" axis.
* **Legend/Key:** Located at the **bottom-right** of the image, outside the main cube.
* A small solid gray cube, identical in appearance to the one inside the main cube.
* Text below it reads: **"SRAM Capacity"**.
* An arrow points from this legend cube towards the interior of the main cube.
* Text above the arrow reads: **"one case"**.
### Detailed Analysis
* **Spatial Relationships:** The diagram visually maps a three-parameter space (Source Unit, Destination Unit, Case). The solid gray cube represents a discrete unit of allocation—"one case"—within this total space.
* **Dimensional Interpretation:** The placement of the "one case" cube suggests that a single case occupies a specific, finite region defined by a range of Source Units, a range of Destination Units, and a single point (or small range) along the Case axis.
* **Capacity Implication:** The label "SRAM Capacity" on the legend cube implies that the entire volume of the large wireframe cube represents the total available Static Random-Access Memory (SRAM). The "one case" cube shows the memory footprint or resource allocation for a single instance or scenario.
### Key Observations
1. **Conceptual, Not Quantitative:** The diagram contains no numerical scales, tick marks, or data points. It is a purely conceptual model illustrating relationships, not a chart of measured values.
2. **Three-Dimensional Allocation:** The use of a cube explicitly frames memory or resource allocation as a function of three independent variables, moving beyond a simple linear or two-dimensional model.
3. **Discrete Unit Emphasis:** The solid cube for "one case" emphasizes that allocation occurs in discrete, block-like units rather than as a continuous fluid.
4. **Visual Hierarchy:** The wireframe represents the total potential space, while the solid cube represents a concrete, occupied subset, creating a clear visual distinction between capacity and utilization.
### Interpretation
This diagram is a **conceptual model for visualizing how a single operational case or task consumes a portion of a system's total SRAM capacity across three dimensions of organization.**
* **What it Suggests:** It implies that system memory (SRAM) is not a monolithic pool but is structured or addressable along three axes: by source (where data/commands originate), by destination (where they are sent or processed), and by case (likely referring to different operational modes, scenarios, or instances). A single "case" requires a block of memory defined by specific ranges on the Source and Destination axes.
* **Relationships:** The total "SRAM Capacity" (the large cube) is the container. The "one case" (the small cube) is a consumer within that container. The diagram helps engineers or architects reason about how many such cases could potentially fit within the total capacity, or how changing the parameters of a case (its source/destination footprint) would affect its memory usage.
* **Underlying Purpose:** This type of visualization is common in hardware design, embedded systems, and memory architecture planning. It aids in resource partitioning, capacity planning, and understanding the multidimensional constraints of a system. The absence of numbers indicates its purpose is to communicate a structural concept rather than specific performance metrics.